
Research ArticleDevelopmentEndocrinologyGenetics
Open Access |  10.1172/jci.insight.205467
Role of Snord116 in pituitary growth hormone deficiency of Prader-Willi syndrome
Gabriel F. Batzli,1 Kaiying Guo,1 Fahrünisa Meryem Betül Erol,1,2 Charles A. LeDuc,1,2 Lisa C. Burnett,3 Rudolph L. Leibel,1,2 and Yiying Zhang1,2
1Department of Pediatrics, Division of Molecular Genetics, Columbia University Irving Medical Center, New York, New York, USA.
2Naomi Berrie Diabetes Center, Columbia University Irving Medical Center, New York, New York, USA.
3Foundation for Prader-Willi Research, Covina, California, USA.
Address correspondence to: Yiying Zhang or Rudolph L. Leibel, Department of Pediatrics, Division of Molecular Genetics, Columbia University Irving Medical Center, New York, New York, 10032, USA. Phone: 212.851.5301; Email: yz84@cumc.columbia.edu (YZ). Phone: 212.851.5257; Email: rl232@cumc.columbia.edu (RLL).
Find articles by Batzli, G. in: PubMed | Google Scholar
1Department of Pediatrics, Division of Molecular Genetics, Columbia University Irving Medical Center, New York, New York, USA.
2Naomi Berrie Diabetes Center, Columbia University Irving Medical Center, New York, New York, USA.
3Foundation for Prader-Willi Research, Covina, California, USA.
Address correspondence to: Yiying Zhang or Rudolph L. Leibel, Department of Pediatrics, Division of Molecular Genetics, Columbia University Irving Medical Center, New York, New York, 10032, USA. Phone: 212.851.5301; Email: yz84@cumc.columbia.edu (YZ). Phone: 212.851.5257; Email: rl232@cumc.columbia.edu (RLL).
Find articles by Guo, K. in: PubMed | Google Scholar
1Department of Pediatrics, Division of Molecular Genetics, Columbia University Irving Medical Center, New York, New York, USA.
2Naomi Berrie Diabetes Center, Columbia University Irving Medical Center, New York, New York, USA.
3Foundation for Prader-Willi Research, Covina, California, USA.
Address correspondence to: Yiying Zhang or Rudolph L. Leibel, Department of Pediatrics, Division of Molecular Genetics, Columbia University Irving Medical Center, New York, New York, 10032, USA. Phone: 212.851.5301; Email: yz84@cumc.columbia.edu (YZ). Phone: 212.851.5257; Email: rl232@cumc.columbia.edu (RLL).
Find articles by Erol, F. in: PubMed | Google Scholar
1Department of Pediatrics, Division of Molecular Genetics, Columbia University Irving Medical Center, New York, New York, USA.
2Naomi Berrie Diabetes Center, Columbia University Irving Medical Center, New York, New York, USA.
3Foundation for Prader-Willi Research, Covina, California, USA.
Address correspondence to: Yiying Zhang or Rudolph L. Leibel, Department of Pediatrics, Division of Molecular Genetics, Columbia University Irving Medical Center, New York, New York, 10032, USA. Phone: 212.851.5301; Email: yz84@cumc.columbia.edu (YZ). Phone: 212.851.5257; Email: rl232@cumc.columbia.edu (RLL).
Find articles by LeDuc, C. in: PubMed | Google Scholar
1Department of Pediatrics, Division of Molecular Genetics, Columbia University Irving Medical Center, New York, New York, USA.
2Naomi Berrie Diabetes Center, Columbia University Irving Medical Center, New York, New York, USA.
3Foundation for Prader-Willi Research, Covina, California, USA.
Address correspondence to: Yiying Zhang or Rudolph L. Leibel, Department of Pediatrics, Division of Molecular Genetics, Columbia University Irving Medical Center, New York, New York, 10032, USA. Phone: 212.851.5301; Email: yz84@cumc.columbia.edu (YZ). Phone: 212.851.5257; Email: rl232@cumc.columbia.edu (RLL).
Find articles by Burnett, L. in: PubMed | Google Scholar
1Department of Pediatrics, Division of Molecular Genetics, Columbia University Irving Medical Center, New York, New York, USA.
2Naomi Berrie Diabetes Center, Columbia University Irving Medical Center, New York, New York, USA.
3Foundation for Prader-Willi Research, Covina, California, USA.
Address correspondence to: Yiying Zhang or Rudolph L. Leibel, Department of Pediatrics, Division of Molecular Genetics, Columbia University Irving Medical Center, New York, New York, 10032, USA. Phone: 212.851.5301; Email: yz84@cumc.columbia.edu (YZ). Phone: 212.851.5257; Email: rl232@cumc.columbia.edu (RLL).
Find articles by Leibel, R. in: PubMed | Google Scholar
1Department of Pediatrics, Division of Molecular Genetics, Columbia University Irving Medical Center, New York, New York, USA.
2Naomi Berrie Diabetes Center, Columbia University Irving Medical Center, New York, New York, USA.
3Foundation for Prader-Willi Research, Covina, California, USA.
Address correspondence to: Yiying Zhang or Rudolph L. Leibel, Department of Pediatrics, Division of Molecular Genetics, Columbia University Irving Medical Center, New York, New York, 10032, USA. Phone: 212.851.5301; Email: yz84@cumc.columbia.edu (YZ). Phone: 212.851.5257; Email: rl232@cumc.columbia.edu (RLL).
Find articles by Zhang, Y. in: PubMed | Google Scholar
Published September 22, 2026 - More info
JCI Insight. 2026;11(18):e205467. https://doi.org/10.1172/jci.insight.205467.
© 2026 Batzli et al. This work is licensed under the Creative Commons Attribution 4.0 International License. To view a copy of this license, visit http://creativecommons.org/licenses/by/4.0/.
Received: February 4, 2026; Accepted: July 31, 2026

-
Results
Snord116 deficiency results in early postnatal growth retardation. The first clinical signs of PWS are failure to thrive and growth retardation in early infancy (1, 2). Snord116-KO mice also manifest growth retardation early in life (14). We compared body weights of pups at P5 in male and female cohorts (Figure 1, A and B). By 2-way ANOVA with genotype and litter size as grouping variables, the genotype effect was significant in both males and females (P < 0.01 and 0.001, respectively). In male Snord116-KO P5 pups, body weight was 24% lower than WT controls (2.39 ± 0.15 vs. 3.15 ± 0.16 g) (Figure 1C). Female Snord116-KO mice were 21% lighter than WT controls (2.69 ± 0.13 vs. 3.39 ± 0.26 g) (Figure 1D). Weighing the pituitary at this age is problematic since these pituitaries are fragile and had to be dissected in buffer to preserve integrity. As measured by the area under the dissecting microscope, the pituitary at P5 was approximately 19% smaller in Snord116-KO mice (Supplemental Figure 1; supplemental material available online with this article; https://doi.org/10.1172/jci.insight.205467DS1). Growth retardation of Snord116-KO mice persisted from P5 to 4–5 weeks of age. In a 4-week-old male cohort, body weight was 20.7% lower in Snord116-KO mice relative to their WT littermates (16.7 ± 0.4 vs. 21.0 ± 0.4 g, P < 0.0001), and body length (naso-anal length) was 6.9% lower (8.32 ± 0.11 vs. 8.94 ± 0.06 cm, P < 0.0001) (Figure 1, E and F). Similarly, in 5-week-old female Snord116-KO mice, body weight (13.44 ± 0.32 vs. 17.88 ± 0.64, P < 0.0001) and naso-anal length (7.86 ± 0.08 vs. 8.53 ± 0.18, P < 0.01) were 25% and 8% lower relative to WT controls (Figure 1, G and H).
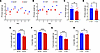 Figure 1
Snord116-KO mice present early postnatal growth retardation. (A and B) Body weight of male (A) and female (B) cohorts at P5. Genotype effect was significant in both males (P < 0.01) and females (P < 0.001) by 2-way ANOVA with genotype and litter size as grouping variables (A and B). (C and D) Body weight of male (C, n = 11–13) and female (D, n = 8–15) pups pooled from litters shown in A and B, respectively. (E and F) Body weight and naso-anal length (NAL) of 5-week-old male mice (n = 8). (G and H) Body weight and NAL of 5-week-old female mice (n = 6–7). Data are expressed as mean ± SEM; *P < 0.05, **P < 0.01, ***P < 0.001, and ****P < 0.0001; KO versus WT by 2-tailed t test (C–H).
Snord116 is expressed in both anterior and posterior pituitary. The neuroendocrine dysfunction observed in individuals with PWS, such as growth retardation and hypogonadism, has been considered to be primarily hypothalamic in origin (1, 2). However, the early postnatal growth retardation and pituitary hypoplasia observed in Snord116-KO mice resemble the growth retardation phenotype of Snell and Ames dwarf mice, which are caused by defects in the key transcription factors mediating pituitary growth: Pou1f1 (Pit1) and Prop1 (28, 29). In contrast, growth retardation in little mice, which is due to a mutation in the cognate receptor for GHRH (Ghrhr), is not detected until P15 (20, 21). Furthermore, Nkx2.1Cre-mediated Snord116 deletion, which causes pan-hypothalamic Snord116 KO, including in the tuberal region of the hypothalamus where GHRH-secreting neurons are located, causes milder growth retardation compared with the germline Snord116 deletion used here. Thus, it is likely that intrinsic Snord116 action in the developing pituitary causes hypoplasia, accounting for the early postnatal growth retardation phenotype. Although SNORD116 expression has been detected in many extra-hypothalamic sites in humans (30), it has been unclear whether Snord116 is expressed in the pituitary of either mice or humans and directly regulates postnatal pituitary development. We found that Snord116 transcript levels were markedly higher in the WT than in Snord116-KO pituitaries (virtually undetectable) at P0, P5, and 4 weeks of age (Figure 2A). No significant age-related differences in Snord116 transcript level were observed between P0 and 4 weeks of age in WT mice by 1-way ANOVA (Figure 2A). As expected, Snord116 KO also led to markedly decreased transcript levels of 116HG in the pituitary, the spliced product of the Snord116 host gene (Figure 2B). mRNA levels of Snrpn, located upstream of the Snord116 cluster and outside of the minimal critical PWS interval but derived from the same primary transcript as Snord116 and 116HG (3–6), were not significantly different between the WT and Snord116-KO pituitaries (Figure 2B).
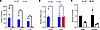 Figure 2
Snord116 is expressed in the mouse pituitary throughout life and in both posterior and anterior pituitary. (A) Snord116 transcript levels (AU) in the WT and Snord116-KO mouse pituitary at P0 (n = 5–8), P5 (n = 8), and 4 weeks of age (n = 5). (B) Relative 116HG RNA levels and Snrpn mRNA levels in the pituitaries of 4-week-old male mice. The average WT level is defined as 1. Data are expressed as mean ± SEM; *P < 0.05, **P < 0.01, ***P < 0.001; KO versus WT by 2-tailed t test (A and B). (C) Snord116 levels normalized to housekeeping gene Ppia in the posterior pituitary (PP) and anterior pituitary (AP) of 12-week-old WT mice as determined by qRT-PCR.
Snord116 transcript levels were assessed in freshly isolated anterior and posterior pituitaries from 12-week-old WT mice. Snord116 transcripts were detected in the reverse transcription (RT) samples of both anterior and posterior pituitaries, and Snord116 PCR signals were barely detectable in the respective RT-controls, in which the reverse transcriptase was omitted (Supplemental Figure 2), indicating that Snord116 detection in the RT samples was not an artifact of genomic DNA contamination. Snord116 levels in the anterior pituitary, normalized to the housekeeping gene Ppia, were about 50% of those of the posterior pituitary in both males and females (Figure 2C).
Snord116 deficiency is associated with an altered balance between cell proliferation and differentiation that is reflected in the transcriptome of immature pituitaries. We performed transcriptomic profiling of Snord116-KO and WT pituitaries by RNA-Seq at P0 and 4 weeks of age. No significant differences in the transcriptomes of Snord116-KO and WT pituitaries were detected in P0 pups other than the transcript encoded by the deleted Snord116 locus, that is, Snord116 host gene Snhg14 (log2 fold-change [FC] = –6.9, FDR < 0.0001). Quantitative RT-PCR analysis of the P0 pituitary RNA samples used for the RNA-Seq study confirmed that levels of 3 transcripts from the Snord116 locus, Snord116, 116HG, and IPW, were markedly decreased in Snord116-KO relative to WT mice, whereas Snrpn mRNA levels were not significantly different between the 2 groups (Supplemental Figure 3). In pituitaries of 4-week-old mice, 1,182 DEGs (FDR < 0.1) were detected: 676 upregulated and 506 downregulated in Snord116-KO mice relative to WT controls (Figure 3A) (Supplemental Table 1). A heatmap of the top 50 DEGs is shown in Figure 3B. H19 (log2 FC = 2.2, FDR < 0.001) and Igf2 (log2 FC = 1.3, FDR < 0.015), 2 important regulators of early postnatal organ development, were among the most upregulated (relative to WT) DEGs in the Snord116-KO pituitary (Supplemental Table 1). Snhg14 (log2 FC = –9.15, FDR < 0.0001), Gpr101 (log2 FC = –1.25, FDR < 0.005), and Lhb (log2 FC = –1.165, FDR = 0.027) were among the most downregulated DEGs in Snord116-KO pituitaries (Supplemental Table 1). Gpr101 is a developmentally regulated gene that has been implicated in the regulation of tonic GH secretion by mature somatotrophs (31–33). Lhb, the gene encoding the β-subunit of luteinizing hormone, is a marker gene for gonadotrophs. Gh transcript level (log2 FC = –0.56, FDR = 0.26) decreased in Snord116-KO pituitaries relative to WT controls, but the difference did not reach statistical significance. Many of the DEGs have been implicated in pituitary development, such as Prop1 (log2 FC = 0.57, FDR = 0.055) and Pou1f1 (also known as Pit1) (log2 FC = –0.27, FDR = 0.078), 2 key developmental pituitary transcription factors for which hypomorphic alleles result in dwarfism (34) (Supplemental Table 1).
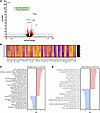 Figure 3
Transcriptomic analysis of pituitaries from 4-week-old male Snord116-KO mice and WT controls. (A) Volcano plot of DEGs. The total number of DEGs (FDR < 0.1) and numbers of upregulated and downregulated DEGs in Snord116-KO pituitaries relative to WT controls are shown in the insert. (B) Heatmap of the top 50 most significant DEGs (FDR < 0.0005, excluding the Snord116 host gene, Sngh14) between Snord116-KO and WT pituitaries, 22 downregulated and 28 upregulated. The color bars show log2-transformed counts per million values of the transcripts. (C) Significantly enriched MSigDB-Hallmark pathways/processes in Snord116-KO pituitaries relative to WT controls (adjusted P < 0.05). (D) Top 10 positively and negatively enriched KEGG pathways/processes in Snord116-KO pituitaries relative to WT controls (adjusted P < 0.05). The number of leading-edge genes relative to the size of the gene set for each enriched pathway is in parentheses following the name of the pathway in C and D. Light red bars represent positively enriched pathways. Light blue bars represent negatively enriched pathways. NES, normalized enrichment score.
Gene set enrichment analysis (GSEA) of 4-week-old pituitary transcriptomes indicated that 21 and 10 Molecular Signatures Database (MSigDB) Hallmark pathways/processes were, respectively, positively and negatively enriched in Snord116-KO relative to WT mice (adjusted P < 0.05). The top positively enriched MSigDB Hallmark processes (increased in KO) included gene sets involved in the regulation of proliferation and development, such as E2f targets, G2M checkpoint, epithelial-mesenchymal transition, mitotic spindle, and genes responding to K-RAS signaling, as well as signaling pathways known to regulate these processes, such as Wnt/β-catenin, TGF-β, Notch, and hedgehog signaling (Figure 3C). Positively enriched Hallmark gene sets in Snord116-KO pituitaries also included genes encoding the components of apical junction and surface as well as genes involved in angiogenesis, myogenesis, and hormone/cytokine signaling (Figure 3C). The top negatively enriched (decreased in KO) processes were involved in metabolism. These included pathways for oxidative phosphorylation and fatty acid metabolism. Protein secretion, unfolded protein response, and mTORC1 signaling, which plays an important role in regulating protein synthesis, were also among the negatively enriched processes in Snord116-KO pituitaries (Figure 3C). Twenty-five Kyoto Encyclopedia of Genes and Genomes (KEGG) pathways were positively enriched and 25 were negatively enriched (adjusted P < 0.05) (Supplemental Table 2); top 10 hits of each set are shown in Figure 3D. Many of the enriched KEGG processes/pathways overlapped with the enriched Hallmark processes (Figure 3, C and D). Additionally, KEGG pathways/processes involved in cell adhesion and migration, such as axon guidance, focal adhesion, and regulation of actin cytoskeleton, were positively enriched in Snord116-KO pituitaries (Figure 3D). The negatively enriched KEGG processes included genes involved in protein export and amino acid metabolism as well as those encoding components of the cellular organelles involved in fatty acid and protein metabolism, such as peroxisome, lysosome, and proteosome (Figure 3D). The GSEA results suggest that pituitaries from 4-week-old Snord116-KO mice were more active in cell proliferation and early developmental programs than those of the WT controls and were less active in substrate and energy metabolism, suggesting that Snord116-KO pituitaries may be less mature than their WT counterparts.
To identify transcriptomic changes associated with normal postnatal pituitary development and maturation, we compared the transcriptomes of P0 and 4-week-old pituitaries from WT mice. A total of 10,670 DEGs were identified (FDR < 0.1) (Figure 4A, Supplemental Table 3). These DEGs, as a signature gene set of “developing and immature pituitary,” were compared with the DEGs from 4-week-old Snord116-KO versus WT mice, as a signature gene set of “Snord116-deficiency in 4-week-old pituitaries.” In P0 WT pituitaries and 4-week-old Snord116-KO pituitaries versus 4-week-old WT pituitaries, 913 DEGs from the 2 signature gene sets overlapped; that is, they were changed in the same direction (541 upregulated and 372 downregulated) (Figure 4B) (Supplemental Table 4), representing 77% of DEGs between 4-week-old Snord116-KO versus WT mice. Fisher’s exact test indicated that the percentage of overlapping DEGs in Snord116-KO versus WT mice at 4 weeks of age (913 out of 1,182 DEGs, 77.2%) was significantly higher than expected by chance when compared with the number of DEGs (10,670 DEGs out of 16,045 genes examined, 66.5%) between P0 and 4-week-old in WT mice (P < 0.0001, OR = 1.71, 95% CI: 1.49–1.96) (Supplemental Table 5). Key pituitary transcription factors, such as Prop1 and Pou1f1; components of the Notch signaling pathway, such as Notch1, Notch3, Jag1, and Dll1; and regulators of early postnatal growth, such as H19 and Igf2, were all among the shared DEGs (Supplemental Table 4). Prop1 expression decreased (log2 FC = 2.33, FDR < 0.0001, P0 vs. week 4 [W4] in WT), and Pou1f1 increased (log2 FC = –0.55, FDR < 0.0001, P0 vs. W4 in WT) during normal postnatal pituitary development from P0 to 4 weeks of age in WT mice. Enrichr analyses showed that pathways related to the regulation of cell cycle and developmental programing, such as epithelial-mesenchymal transition and G2-M checkpoint, predominated in the upregulated DEGs shared by P0 and 4-week-old Snord116-KO pituitaries (Figure 4, C and D), while protein secretion, unfolded protein response, and fatty acid degradation pathways predominated in the shared downregulated DEGs (Figure 4, G and H). Consistent with the enrichment of MSigDB Hallmark pathways/processes that regulate cell proliferation, targets of transcription factors Foxm1, Suz12, and E2F4, which are activators of cell proliferation/division, were enriched in the shared upregulated DEGs (Figure 4E), and so were several protein-protein interaction (PPI) hub proteins, such as PLK1, PCNA, and CDK1 (Figure 4F), which have been implicated in regulating cell division, DNA replication, and cell cycle progression. Taken together, these results suggest that Snord116 deficiency in the pituitary alters the balance between cell proliferation and differentiation during early postnatal pituitary development, leading to delay and/or attenuation of terminal differentiation/maturation of the hormone-secreting pituitary cells, including somatotrophs in the anterior pituitary.
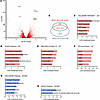 Figure 4
Transcriptomic features shared by male 4-week-old Snord116-KO and immature P0 WT pituitaries. (A) Volcano plot of a total of 10,670 DEGs from P0 versus 4-week-old (W4) WT pituitaries (FDR < 0.1). (B) 913 DEGs were shared in the same directions among a total of 1,182 DEGs from Snord116-KO (KO) versus WT at 4 weeks of age (W4) and a total of 10,607 DEGs from P0 versus W4 in WT. Among the shared 913 DEGs, 541 were upregulated and 372 were downregulated in both P0_WT and W4_KO relative to W4 _WT. (C–F) Enrichr analysis results of the 541 upregulated DEGs shared by P0_WT and W4_KO relative to W4_WT (adjusted P < 0.05) (light red bar graphs), enriched HALLMARK pathways (C), enriched KEGG pathways (D), enriched ENCODE and ChIP enrichment analysis (ChEA) consensus transcription factors (TFs) from ChIP-X (E), and enriched protein-protein interaction (PPI) hub proteins (F). (G and H) Enrichr analysis results of the 372 downregulated DEGs shared by P0_WT and W4_KO relative to W4_WT (adjusted P < 0.05) (light blue bar graphs), enriched HALLMARK pathways (G), and enriched KEGG pathways (H). No significant enriched ENCODE and ChEA consensus TFs from ChIP-X or PPI hub proteins were detected by Enrichr among the shared 372 downregulated DEGs. The combined scores were calculated by Enrichr based on Fisher’s exact test P value and z score for deviation from the expected rank, reflecting the significance of the enrichment. The combined scores were then log10-transformed and plotted.
To quantitatively analyze the maturity of 4-week-old Snord116-KO (W4_KO) pituitaries relative to WT controls at P0 and 4 weeks of age (P0_WT and W4_WT), we first examined global transcriptomic relationships across all samples using standard principal component analysis (PCA) with the top 500 highly variable genes. PC1 explained 85.1% of the variance and separated P0 from W4 pituitaries with strong overlap between P0_WT and P0_KO samples and a detectable shift of W4_KO samples relative to W4_WT controls (Supplemental Figure 4). To quantify the position of W4_KO samples along the normal WT pituitary maturation trajectory, we constructed a WT reference PCA framework to capture the normal WT developmental trajectory without influence from KO-specific transcriptional variation. PCA was trained exclusively on WT samples using the top 500 highly variable genes between P0_WT and W4_WT; KO samples were then passively projected into this WT-defined coordinate system (Figure 5A). PC1, which explained 93.0% of the variance between P0_WT and W4_WT pituitaries, was interpreted as the principal postnatal maturation axis in WT. Again, P0_KO pituitaries largely overlapped with P0_WT samples along this axis, whereas W4_KO samples shifted away from W4_WT samples and occupied a relatively less mature position along the WT-defined maturation axis (Figure 5A). Normalized maturation index (NMI) calculated by rescaling each sample’s WT-reference PC1 score relative to the P0_WT and W4_WT group means, which were defined as 0 and 1, respectively, indicated that W4_KO pituitaries reached a mean NMI of 0.858 ± 0.065, compared with 1.000 ± 0.039 in W4_WT controls (Figure 5B). This difference was statistically significant by a 1-sided Wilcoxon’s rank-sum test (W = 25, P = 0.0040; rank-biserial r = 1.00, indicating complete rank separation) and a permutation test (P = 0.0044). We further validated the NMI result using a PCA-independent normalized maturation score (NMS), which was calculated based on WT maturation-associated genes (i.e., DEGs between P0_WT and W4_WT). W4_KO pituitaries reached a mean NMS of 0.870 ± 0.047 (Supplemental Figure 5), again indicating incomplete maturation relative to W4_WT controls. NMI and NMS were almost perfectly correlated across all 20 samples (Pearson’s r = 0.9990, 95% CI: 0.9974–0.9996, P = 8.40 × 10⁻²⁶) (Figure 5C), demonstrating that the PCA-based maturation index (NMI) and the independent gene-signature score (NMS) captured the same biological signal.
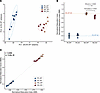 Figure 5
Transcriptomic analysis shows molecular signature of attenuated postnatal pituitary maturation in Snord116-KO mice. (A) WT-reference PCA of pituitary RNA-Seq data from WT and Snord116-KO mice at P0 and 4 weeks of age (W4). The PCA space was defined using WT samples, and KO samples were then projected into this space. PC1 (93.0% variance) represents the postnatal maturation axis. (B) PCA-based NMI, which was scaled to the mean P0_WT and W4_WT reference states. W4_KO pituitaries reached only 86% of the W4_WT maturation level, which was statistically significant by 1-sided Wilcoxon’s rank-sum test and permutation test (both P < 0.01). (C) Concordance between the PCA-based NMI and the PCA-independent NMS of all samples, r = 0.9990, 95% CI: 0.9974–0.9996, P = 8.40 × 10⁻²⁶, by Pearson’s correlation analysis.
Decreased basal and GHRH-stimulated GH secretions in Snord116-KO pituitaries are due to decreased pituitary size and GH production. We investigated GH protein production and secretion in Snord116-KO and WT pituitaries. In 5-week-old female Snord116-KO pituitaries, total protein and GH content were, respectively, 33% (P < 0.001) and 44.4% (P < 0.001) lower than those of WT pituitaries (Figure 6, A and B). GH content normalized to total protein content was 27% (P < 0.01) lower in the mutant pituitaries relative to WT (Figure 6C). Similar results were also observed in the pituitary extracts from 5-week-old male mice after they had been subjected to perifusion (Supplemental Figure 6). These results indicated that Snord116-KO mice had decreased pituitary size with lower GH content relative to pituitary cell mass. In 5-week-old male mice, absolute amounts of GH secreted during the perifusion of isolated pituitaries in the basal state and after a bolus stimulation with 10–7 M GHRH were significantly lower in the Snord116-KO versus WT mice (Figure 7A). When GH secretion rates were normalized to pituitary GH content (Supplemental Figure 6A), there was no significant difference between Snord116-KO and WT pituitaries in either the basal or GHRH-stimulated state (Figure 7B). The mean absolute GH secretion rate in the basal state (between 25 and 40 minutes) was significantly lower (P < 0.01) in the KO mice (Figure 7C); this difference was eliminated by normalizing with GH content (Figure 7D). GHRH increased GH secretion by 84% (WT) and 104% (Snord116-KO) relative to the basal state, but the difference was not statistically significant (P = 0.69; Figure 7, E and F). In the aggregate, these results suggest that decreased pituitary cell mass and maturity, not the GH secretory function of the cells, is the primary cause of GH deficiency in Snord116-KO mice.
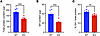 Figure 6
Pituitary total protein and GH are decreased in 5-week-old female Snord116-KO mice relative to WT controls. (A) Pituitary total protein content. (B) Pituitary GH content. (C) GH content normalized to total protein content (n = 6–7). Data are expressed as mean ± SEM; **P < 0.01 and ***P 0.001; KO versus WT by 2-tailed t test.
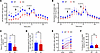 Figure 7
GH secretion in the basal and GHRH-stimulated states in pituitaries of 5-week-old male Snord116-KO and WT mice. (A) GH secretion rate (ng/5 min) during the perifusion experiments (n = 8). The time point when a 5-minute perfusion with medium containing 10–7 M GHRH or 55 mM KCl is indicated. (B) GH secretion rate in A was normalized to the tissue GH content. (C) Basal GH secretion rate was averaged from effluent collected between the 25- and 40-minute time points. (D) The average basal GH secretion rate after normalization to tissue GH content. (E) The change in the average GH secretion rates in the basal state (25–40 minutes) and after GHRH stimulation (45–70 minutes) in the Snord116-KO and WT pituitaries. (F) The average fold increases in GH secretion rate after GHRH stimulation. Data are expressed as mean ± SEM; *P < 0.05; KO versus WT by 2-tailed t test.
-
Discussion
Summary of main findings/conclusion. Snord116 deficiency in mice results in pituitary hypoplasia that is accompanied by postnatal GH-deficient growth retardation. In 4- to 5-week-old mice, we found that pituitary GH content relative to pituitary size was disproportionally decreased in Snord116-KO mice: a 33% reduction in pituitary protein content (a surrogate for pituitary size) and a 44.3% reduction in GH content. These quantitative differences suggest that pituitary hypoplasia in the mutant mice is likely associated with a reduced number of GH-producing cells at this developmental stage. Ex vivo GH secretion analysis in 5-week-old male mice indicated that GH deficiency in Snord116-KO mice is primarily due to pituitary hypoplasia and decreased GH synthesis; GH secretory function per se was minimally affected either in the basal state or in response to GHRH stimulation in Snord116-KO mice. It is reasonable to assume that GH secretion results obtained in the prepubertal male pituitaries are extrapolatable to the females given that all other growth and pituitary phenotypes of the PWS mouse model examined in this study were not sexually dimorphic. Growth deficiency is not a sexually dimorphic trait in individuals with PWS either (1, 2).
Contrary with our results, an earlier study found no significant differences in the number of somatotrophs and GH immunogenicity between Snord116-KO and WT mice at 4 weeks of age (14). The conflicting results may reflect, in part, methodological differences: the respective abilities of ELISA and IHC staining to accurately quantify pituitary GH content. In our study, GH concentration in the tissue lysate was measured by ELISA, and tissue GH content was calculated by multiplying lysate GH concentration with the volume of tissue lysate, which accounted for changes in both pituitary size and GH production rate. In contrast, IHC staining used in the previous study could not accurately quantify changes in GH production rate or pituitary size (14). Buttressing our inference, human pituitary size (measured by MRI) is about 50% smaller in children and young adults with PWS compared with unaffected individuals of the same age (27). Our profiling of pituitary gene expression also suggests that differentiation of gonadotrophs was affected in Snord116-KO mice, consistent with the delayed vaginal opening in female mutant mice (14), suggesting that Snord116 deficiency may affect the cellular ontogeny of anterior pituitary hormone–producing cells at or prior to the divergence of terminal differentiation of gonadotrophs and cells of Pou1f1 lineage (somatotrophs, lactotrophs, and thyrotropes) during the early postnatal period (35) (Figure 8).
 Figure 8
Snord116 may influence the development of hormone-producing cells in the anterior pituitary by regulating Prop1 expression/function. Prop1 is a pituitary-specific paired-like homeodomain transcription factor. The expression of Prop1 activates epithelial-mesenchymal transition during the early stages of pituitary development that is essential for the development of all hormone-producing cells in the anterior pituitary; downregulation of Prop1 expression in the later developmental stages is required for the terminal differentiation of gonadotrophs (50, 51). Prop1 expression decreases during normal postnatal pituitary development from P0 to 4 weeks of age in WT mice. Snord116 deficiency leads to elevated Prop1 expression and decreased expression of Pou1f1, a transcription factor that is activated by Prop1 and is required for the terminal differentiation of somatotrophs, lactotrophs, and thyrotropes, in 4-week-old Snord116-KO pituitaries relative to WT controls (box in upper left). Although it is possible that the changes in Prop1 and Pou1f1 expression in 4-week-old Snord116-KO pituitaries may reflect the decreased maturity of KO pituitaries, we hypothesize that Snord116 may regulate Prop1 expression/function in Prop1-expressing progenitor cells, and that the elevated (or dysregulated) Prop1 expression in these cells due to Snord116 deficiency delays and/or attenuates the terminal differentiation of all hormone-producing cells, resulting in attenuated postnatal pituitary expansion and maturation.
We have demonstrated that Snord116 is expressed in both anterior and posterior lobes of the pituitary throughout life, albeit at much lower levels than those found in the brain based on the Ct values of qRT-PCR with similar RNA inputs from the 2 tissues (unpublished observations). Low levels of Snord116 expression in pituitaries of 5-week-old mice suggest that Snord116 expression may be limited to a subpopulation of pituitary cells. At 4 weeks of age, Snord116 deficiency is associated with gene expression profiles that are remarkably similar to those of pituitaries from WT newborn pups: high in proliferative progenitor cells and low in hormone-producing cells. PCAs of pituitary transcriptomes confirmed that Snord116-KO pituitaries are less mature than WT controls at 4 weeks of age. These results suggest that Snord116 deficiency attenuates the postnatal differentiation/expansion of hormone-producing cells in the anterior lobe, contributing to growth retardation and other neuroendocrine dysfunctions of Snord116-KO mice.
Characteristics of postnatal growth retardation in Snord116-KO mice. Body weights of Snord116-KO mice are not different from WT littermates at birth; pituitary size and morphology appear normal at E18.5 (14). We found that pituitary size and gene expression profiles were not significantly different between Snord116-KO and WT mice at birth, indicating that pituitary hypoplasia and growth retardation in Snord116-KO mice begin after birth. The postnatal growth retardation phenotype observed in Snord116-KO mice resembles that of the Ames (df) and Snell (dw) dwarfs in that growth retardation manifests during the early postnatal period and is accompanied by pituitary hypoplasia (36–38). Ames dwarf and Snell dwarf mice segregate for recessive mutations in the Prop1 and Pou1f1 (aka Pit1) genes, respectively, which encode 2 key pituitary-specific transcription factors required for the expansion and differentiation of hormone-producing cells in the anterior lobe (28, 29, 35). Both Prop1 and Pou1f1 transcript levels were also altered, increased and decreased, respectively, in Snord116-KO pituitaries relative to WT controls. Like Snord116-KO mice, Snell dwarf mice do not differ in body weight or length from WT mice at birth but quickly develop severe growth retardation due to virtually complete absence of somatotrophs and GH (28). In contrast, growth retardation in mice segregating for a missense mutation in Ghrhr, which encodes the anterior pituitary somatotroph receptor for the hypothalamic GHRH, becomes detectable later, around P15 (20, 21, 39). These differences suggest that in Snord116-KO mice, the early postnatal growth retardation is unlikely to be related to impaired hypothalamic function. Consistent with this inference, the growth retardation phenotype is significantly milder in mice with Nkx2.1 Cre-mediated conditional hypothalamic deletion of Snord116 (unpublished observations). Adult body weights of Snord116-KO mice are approximately 85% of WT mice (14), whereas the adult body weight of mice with Nkx2.1 Cre-mediated conditional deletion of Snord116 is about 92% of WT mice. These differences suggest that Snord116 deficiency in extra-hypothalamic sites contributes to the postnatal growth retardation in Snord116-KO mice.
Mechanistic insights on the role of Snord116 action in postnatal pituitary development from transcriptomic profiling. Mouse pituitary mass expands dramatically during the first 3 postnatal weeks through proliferation and differentiation of pituitary progenitor cells (40–42). Although pituitary transcriptomes of Snord116 P0 pups were not significantly different from WT (outside the targeted manipulation), by 4 weeks of age these transcriptomes were markedly different from each other. The most upregulated pathways in 4-week-old Snord116-KO pituitaries were those related to the regulation of cell cycle progression and epithelial-mesenchymal transition, processes essential for activating and mobilizing pituitary stem/progenitor cells prior to their terminal differentiation into hormone-producing cells (43, 44). The components of several signaling pathways, such as hedgehog, Wnt/β catenin, and Notch, which regulate embryonic and early postnatal pituitary development (45), were also upregulated in pituitaries from 4-week-old Snord116-KO mice, presumably reflecting delayed/attenuated pituitary development and maturation in Snord116-KO mice.
The pituitary transcriptomes of 4-week-old Snord116-KO mice resemble those of P0 WT (or Snord116-KO) pituitaries. Furthermore, 77% of the DEGs between Snord116-KO and WT pituitaries at 4 weeks of age were also differentially expressed in the same direction in WT P0 pituitaries when compared with 4-week-old WT pituitaries. Gene ontology analysis of the shared upregulated DEGs again points to the enrichment of genes involved in regulating cell cycle progression and epithelial-mesenchymal transition, underscoring similarities between 4-week-old Snord116-KO pituitaries and the immature P0 WT pituitaries. Sox2+ pituitary stem cells are highly proliferative during the first 2–3 weeks of life in concordance with major organ growth (46–49). Prop1, the pituitary-specific and paired-like homeodomain transcription factor mutated in Ames dwarf mice (29), stimulates Sox2+ stem cells to undergo epithelial-mesenchymal–like transition, cell migration, and proliferation prior to their differentiation toward hormone-producing cells (43). Prop1 also plays an important role in regulating Sox2 expression and stem cell proliferation critical for the maintenance of self-renewal of pituitary stem cells (43). We found that Prop1 transcript, which was decreased during normal postnatal pituitary development in the WT mice from P0 to 4 weeks of age, was upregulated in Snord116-KO pituitaries relative to WT controls at 4 weeks. Temporal control of Prop1 expression is critical for the development of gonadotrophs (50, 51). In humans, mutations in Prop1 are associated with combined pituitary hormone deficiency that includes TSH, PRL, GH, GN, and ACTH deficiency (52–56), resembling the endocrine abnormalities observed in PWS (1, 2). We found that Pou1f1, which acts downstream of Prop1 and is critical for the terminal differentiation of somatotrophs, lactotrophs, and thyrotropes, was downregulated along with decreased expression of Lhb, a marker of gonadotrophs, in Snord116-KO mice. These observations, along with the upregulated expression of cell cycle and epithelial-mesenchymal transition genes, suggest that Snord116 may regulate Prop1 expression and/or function. As shown in Figure 8, although acknowledging that the exact relationship between Snord116 deficiency and elevated Prop1 expression is unknown, we speculate that elevated and/or dysregulated Prop1 expression in Snord116-KO pituitary may attenuate or delay the terminal differentiation of all hormone-producing cells in the anterior pituitary, leading to multiple neuroendocrine abnormalities in Snord116-KO mice and in individuals with PWS.
Genes involved in oxidative phosphorylation, fatty acid oxidation, and glycolysis, as well as protein secretion and unfolded protein response, were downregulated in 4-week-old Snord116-KO compared with WT pituitaries. Consistently, genes encoding the components of cellular organelles specialized in performing these processes, such as peroxisome, proteosome, and lysosome, were also downregulated. These specific transcriptomic profiles likely reflect the relative immaturity of Snord116-KO pituitaries and decreased numbers of hormone-producing cells, which are specialized in the energy-demanding cellular processes of producing and secreting hormones.
In contrast with the results obtained in pituitaries of 4-week-old Snord116-KO mice, in the P5 hypothalamus of Snord116-KO mice, genes involved in protein synthesis and secretion were upregulated, whereas those involved in regulating cell cycle progression were downregulated (unpublished observations). These results suggest that the effects of Snord116 are tissue type– and developmental stage–specific and that an assumption of universality may lead to false inferences from negative experiments.
Gpr101 is a highly downregulated gene in 4-week-old Snord116-KO pituitaries. Gpr101 induces GH secretion via Gs and Gq/11 signaling pathways involving both PKA and PKC (32). Duplication of Gpr101 causes X-linked acrogigantism in humans; transgenic overexpression of the gene in somatotrophs causes hypersecretion of GH and prolactin and gigantism in mice (31, 32, 57). In rats, Gpr101 is co-expressed with GH in somatotrophs (58). In the Rhesus monkey and mouse, Gpr101 is expressed mainly in Gnrhr-expressing cells, that is, gonadotrophs (Single cell portal — Broad Institute) (59). In Snord116-KO mice, decreased Gpr101 expression, together with decreased expression of hormone-specific luteinizing hormone β subunit (Lhb), suggest that gonadotroph differentiation is affected by Snord116 deficiency. Consistent with the pituitary gene expression profile, vaginal opening was delayed by 3.6 days in Snord116-KO mice (14), recapitulating the gonadal axis neuroendocrine abnormalities found in patients with PWS (1, 2). The combined deficiencies in gonadotrophs and somatotrophs in Snord116-KO pituitaries strengthen the notion that Snord116 acts at a point in the postnatal pituitary differentiation process before the divergence of these 2 specific hormone-producing cells, as shown in Figure 8 (35).
In summary, Snord116 acts in the anterior pituitary during the early postnatal period to modulate postnatal expansion and maturation of hormone-producing cells. The growth retardation phenotype and delayed sexual maturation in Snord116-KO mice, and transcriptomic profiles of P0 and P4 pituitaries, suggest that Snord116 may influence postnatal pituitary expansion and differentiation by modulating Prop1 expression and/or cellular processes regulated by Prop1, such as self-renewal of Sox2+ progenitor cells, the epithelial-mesenchymal transition, and consequently, terminal differentiation of hormone-producing cells in the anterior pituitary (Figure 8). It is possible that instances of panhypopituitarism in humans might be due to developmental somatic inactivation of SNORD116.
The posterior pituitary, which also expresses Snord116, plays an important role in regulating the secretion of neuropeptide oxytocin. Oxytocin deficiency is a canonical PWS phenotype. The potential role of Snord116 in regulating the development/function of the posterior pituitary and the oxytocin axis warrants further study.
The pituitary cell population(s) in which Snord116 is expressed is currently unknown. Available pituitary single-cell sequencing datasets have no information on Snord116 expression because the current single-cell RNA-Seq technology is unable to co-profile small RNAs with mRNAs. However, new strategies are being developed to simultaneously co-profile small RNA and mRNA at single-cell resolution (60, 61). After the cell populations in which Snord116 is expressed are identified, single-cell RNA-Seq could assess cell-autonomous effects of Snord116 KO in Snord116-expressing cells and paracrine effects of Snord116 KO in distinct populations of non–Snord116-expressing cells across different developmental stages, providing potentially new insights into molecular mechanisms by which Snord116 regulates the development of different pituitary cell populations.
Limitations of this study. The anatomic, molecular, and ex vivo perifusion data here clearly implicate Snord116 in ontogeny of pituitary somatotrophs. We did not, however, measure the basal and stimulated GH secretion in vivo in WT and Snord116 hypomorphic animals at P5 or week 4. Early postnatal malnutrition may cause subsequent growth retardation. As we and others have shown, the severe early onset postnatal growth retardation in Snord116-KO mice — characterized by a 25% reduction in body weight associated with a 44% reduction in pituitary GH content at 5 weeks of age — persists from P5 to 4 weeks of age. However, there is significant catch up in growth after weaning, eventuating in only a moderate 15% reduction of body weight in adult Snord116-KO mice. Infants with PWS display hypotonia and feeding/swallowing difficulty resulting in early failure to thrive (1, 2). It is possible that Snord116-KO mice have similar feeding difficulties during the early postnatal period, contributing to the growth retardation phenotype that is more severe during the early postnatal period than in adulthood. Ding et al. reported no significant difference in the size of the gastric milk spot between Snord116-KO and WT pups, and the mutant mice appeared to have no hypotonia when tested at P5 and 3 weeks of age (14). Thus, additional factors, such as malabsorption, may also contribute to the growth retardation phenotype of Snord116-KO mice. Infants with PWS also have diarrhea and other gastrointestinal symptoms (1, 2). Based on our observation that the number of ghrelin-producing gastric cells is increased in Snord116-KO mice (unpublished observations), it is possible that Snord116 deletion may affect the differentiation of gastrointestinal stem cells, impairing both neuroendocrine and absorptive functions. Additionally, we cannot rule out the possibility that Snord116 deletion may affect the expression of other noncoding RNAs in the vicinity, contributing to the pituitary phenotype observed in the current study.


