
Research ArticleHepatologyImmunologyInflammation
Open Access |  10.1172/jci.insight.203495
Integrated single-cell multiomics reveals neutrophil-driven immune-metabolic reprogramming of Kupffer cells via thrombospondin-1/CD36 after surgical stress
Hongji Zhang,1 Xingping Huang,2 Preethi Jayakumar,2 Yunwei Zhang,1 Ti Yang,2 Xiaorong Guo,2 Grace Wu,2,3 Amrendra Kumar,4 Vijaya Bharti,4 Amblessed Onuma,5 Chengli Shen,1 Dequan Lou,6 Patricia S. Latham,7 James M. Crawford,8 Kong Chen,6 Anna E. Vilgelm,4 Lopa Mishra,9 Allan Tsung,1 Meihong Deng,2,3 and Hai Huang2,3,10
1Department of Surgery, School of Medicine, University of Virginia, Charlottesville, Virginia, USA.
2Center for Immunology and Inflammation, Institute of Translational Research, Feinstein Institutes for Medical Research, Manhasset, New York, USA.
3Department of Surgery, Northwell Health, Manhasset, New York, USA.
4Department of Pathology, The Ohio State University, Columbus, Ohio, USA.
5Department of Surgical Oncology, MD Anderson Cancer Center, Houston, Texas, USA.
6Department of Medicine, University of Pittsburgh, Pittsburgh, Pennsylvania, USA.
7Department of Pathology, George Washington University, Washington, DC, USA.
8Department of Pathology and Laboratory Medicine, Northwell Health, Manhasset, New York, USA.
9Institute for Bioelectronic Medicine, Feinstein Institutes for Medical Research and Cold Spring Harbor Laboratory, Department of Medicine, Division of Gastroenterology and Hepatology, Northwell Health, Manhasset, New York, USA.
10Division of Hepatology, Department of Medicine, Northwell Health, Manhasset, New York, USA.
Address correspondence to: Hai Huang, Center for Immunology and Inflammation, Feinstein Institutes for Medical Research, 350 Community Drive, Manhasset, New York 11030, USA. Email: hhuang10@northwell.edu.
Authorship note: HZ and XH contributed equally to this work.
Find articles by Zhang, H. in: PubMed | Google Scholar
1Department of Surgery, School of Medicine, University of Virginia, Charlottesville, Virginia, USA.
2Center for Immunology and Inflammation, Institute of Translational Research, Feinstein Institutes for Medical Research, Manhasset, New York, USA.
3Department of Surgery, Northwell Health, Manhasset, New York, USA.
4Department of Pathology, The Ohio State University, Columbus, Ohio, USA.
5Department of Surgical Oncology, MD Anderson Cancer Center, Houston, Texas, USA.
6Department of Medicine, University of Pittsburgh, Pittsburgh, Pennsylvania, USA.
7Department of Pathology, George Washington University, Washington, DC, USA.
8Department of Pathology and Laboratory Medicine, Northwell Health, Manhasset, New York, USA.
9Institute for Bioelectronic Medicine, Feinstein Institutes for Medical Research and Cold Spring Harbor Laboratory, Department of Medicine, Division of Gastroenterology and Hepatology, Northwell Health, Manhasset, New York, USA.
10Division of Hepatology, Department of Medicine, Northwell Health, Manhasset, New York, USA.
Address correspondence to: Hai Huang, Center for Immunology and Inflammation, Feinstein Institutes for Medical Research, 350 Community Drive, Manhasset, New York 11030, USA. Email: hhuang10@northwell.edu.
Authorship note: HZ and XH contributed equally to this work.
Find articles by Huang, X. in: PubMed | Google Scholar
1Department of Surgery, School of Medicine, University of Virginia, Charlottesville, Virginia, USA.
2Center for Immunology and Inflammation, Institute of Translational Research, Feinstein Institutes for Medical Research, Manhasset, New York, USA.
3Department of Surgery, Northwell Health, Manhasset, New York, USA.
4Department of Pathology, The Ohio State University, Columbus, Ohio, USA.
5Department of Surgical Oncology, MD Anderson Cancer Center, Houston, Texas, USA.
6Department of Medicine, University of Pittsburgh, Pittsburgh, Pennsylvania, USA.
7Department of Pathology, George Washington University, Washington, DC, USA.
8Department of Pathology and Laboratory Medicine, Northwell Health, Manhasset, New York, USA.
9Institute for Bioelectronic Medicine, Feinstein Institutes for Medical Research and Cold Spring Harbor Laboratory, Department of Medicine, Division of Gastroenterology and Hepatology, Northwell Health, Manhasset, New York, USA.
10Division of Hepatology, Department of Medicine, Northwell Health, Manhasset, New York, USA.
Address correspondence to: Hai Huang, Center for Immunology and Inflammation, Feinstein Institutes for Medical Research, 350 Community Drive, Manhasset, New York 11030, USA. Email: hhuang10@northwell.edu.
Authorship note: HZ and XH contributed equally to this work.
Find articles by Jayakumar, P. in: PubMed | Google Scholar
1Department of Surgery, School of Medicine, University of Virginia, Charlottesville, Virginia, USA.
2Center for Immunology and Inflammation, Institute of Translational Research, Feinstein Institutes for Medical Research, Manhasset, New York, USA.
3Department of Surgery, Northwell Health, Manhasset, New York, USA.
4Department of Pathology, The Ohio State University, Columbus, Ohio, USA.
5Department of Surgical Oncology, MD Anderson Cancer Center, Houston, Texas, USA.
6Department of Medicine, University of Pittsburgh, Pittsburgh, Pennsylvania, USA.
7Department of Pathology, George Washington University, Washington, DC, USA.
8Department of Pathology and Laboratory Medicine, Northwell Health, Manhasset, New York, USA.
9Institute for Bioelectronic Medicine, Feinstein Institutes for Medical Research and Cold Spring Harbor Laboratory, Department of Medicine, Division of Gastroenterology and Hepatology, Northwell Health, Manhasset, New York, USA.
10Division of Hepatology, Department of Medicine, Northwell Health, Manhasset, New York, USA.
Address correspondence to: Hai Huang, Center for Immunology and Inflammation, Feinstein Institutes for Medical Research, 350 Community Drive, Manhasset, New York 11030, USA. Email: hhuang10@northwell.edu.
Authorship note: HZ and XH contributed equally to this work.
Find articles by Zhang, Y. in: PubMed | Google Scholar
1Department of Surgery, School of Medicine, University of Virginia, Charlottesville, Virginia, USA.
2Center for Immunology and Inflammation, Institute of Translational Research, Feinstein Institutes for Medical Research, Manhasset, New York, USA.
3Department of Surgery, Northwell Health, Manhasset, New York, USA.
4Department of Pathology, The Ohio State University, Columbus, Ohio, USA.
5Department of Surgical Oncology, MD Anderson Cancer Center, Houston, Texas, USA.
6Department of Medicine, University of Pittsburgh, Pittsburgh, Pennsylvania, USA.
7Department of Pathology, George Washington University, Washington, DC, USA.
8Department of Pathology and Laboratory Medicine, Northwell Health, Manhasset, New York, USA.
9Institute for Bioelectronic Medicine, Feinstein Institutes for Medical Research and Cold Spring Harbor Laboratory, Department of Medicine, Division of Gastroenterology and Hepatology, Northwell Health, Manhasset, New York, USA.
10Division of Hepatology, Department of Medicine, Northwell Health, Manhasset, New York, USA.
Address correspondence to: Hai Huang, Center for Immunology and Inflammation, Feinstein Institutes for Medical Research, 350 Community Drive, Manhasset, New York 11030, USA. Email: hhuang10@northwell.edu.
Authorship note: HZ and XH contributed equally to this work.
Find articles by Yang, T. in: PubMed | Google Scholar
1Department of Surgery, School of Medicine, University of Virginia, Charlottesville, Virginia, USA.
2Center for Immunology and Inflammation, Institute of Translational Research, Feinstein Institutes for Medical Research, Manhasset, New York, USA.
3Department of Surgery, Northwell Health, Manhasset, New York, USA.
4Department of Pathology, The Ohio State University, Columbus, Ohio, USA.
5Department of Surgical Oncology, MD Anderson Cancer Center, Houston, Texas, USA.
6Department of Medicine, University of Pittsburgh, Pittsburgh, Pennsylvania, USA.
7Department of Pathology, George Washington University, Washington, DC, USA.
8Department of Pathology and Laboratory Medicine, Northwell Health, Manhasset, New York, USA.
9Institute for Bioelectronic Medicine, Feinstein Institutes for Medical Research and Cold Spring Harbor Laboratory, Department of Medicine, Division of Gastroenterology and Hepatology, Northwell Health, Manhasset, New York, USA.
10Division of Hepatology, Department of Medicine, Northwell Health, Manhasset, New York, USA.
Address correspondence to: Hai Huang, Center for Immunology and Inflammation, Feinstein Institutes for Medical Research, 350 Community Drive, Manhasset, New York 11030, USA. Email: hhuang10@northwell.edu.
Authorship note: HZ and XH contributed equally to this work.
Find articles by Guo, X. in: PubMed | Google Scholar
1Department of Surgery, School of Medicine, University of Virginia, Charlottesville, Virginia, USA.
2Center for Immunology and Inflammation, Institute of Translational Research, Feinstein Institutes for Medical Research, Manhasset, New York, USA.
3Department of Surgery, Northwell Health, Manhasset, New York, USA.
4Department of Pathology, The Ohio State University, Columbus, Ohio, USA.
5Department of Surgical Oncology, MD Anderson Cancer Center, Houston, Texas, USA.
6Department of Medicine, University of Pittsburgh, Pittsburgh, Pennsylvania, USA.
7Department of Pathology, George Washington University, Washington, DC, USA.
8Department of Pathology and Laboratory Medicine, Northwell Health, Manhasset, New York, USA.
9Institute for Bioelectronic Medicine, Feinstein Institutes for Medical Research and Cold Spring Harbor Laboratory, Department of Medicine, Division of Gastroenterology and Hepatology, Northwell Health, Manhasset, New York, USA.
10Division of Hepatology, Department of Medicine, Northwell Health, Manhasset, New York, USA.
Address correspondence to: Hai Huang, Center for Immunology and Inflammation, Feinstein Institutes for Medical Research, 350 Community Drive, Manhasset, New York 11030, USA. Email: hhuang10@northwell.edu.
Authorship note: HZ and XH contributed equally to this work.
Find articles by Wu, G. in: PubMed | Google Scholar
1Department of Surgery, School of Medicine, University of Virginia, Charlottesville, Virginia, USA.
2Center for Immunology and Inflammation, Institute of Translational Research, Feinstein Institutes for Medical Research, Manhasset, New York, USA.
3Department of Surgery, Northwell Health, Manhasset, New York, USA.
4Department of Pathology, The Ohio State University, Columbus, Ohio, USA.
5Department of Surgical Oncology, MD Anderson Cancer Center, Houston, Texas, USA.
6Department of Medicine, University of Pittsburgh, Pittsburgh, Pennsylvania, USA.
7Department of Pathology, George Washington University, Washington, DC, USA.
8Department of Pathology and Laboratory Medicine, Northwell Health, Manhasset, New York, USA.
9Institute for Bioelectronic Medicine, Feinstein Institutes for Medical Research and Cold Spring Harbor Laboratory, Department of Medicine, Division of Gastroenterology and Hepatology, Northwell Health, Manhasset, New York, USA.
10Division of Hepatology, Department of Medicine, Northwell Health, Manhasset, New York, USA.
Address correspondence to: Hai Huang, Center for Immunology and Inflammation, Feinstein Institutes for Medical Research, 350 Community Drive, Manhasset, New York 11030, USA. Email: hhuang10@northwell.edu.
Authorship note: HZ and XH contributed equally to this work.
Find articles by Kumar, A. in: PubMed | Google Scholar
1Department of Surgery, School of Medicine, University of Virginia, Charlottesville, Virginia, USA.
2Center for Immunology and Inflammation, Institute of Translational Research, Feinstein Institutes for Medical Research, Manhasset, New York, USA.
3Department of Surgery, Northwell Health, Manhasset, New York, USA.
4Department of Pathology, The Ohio State University, Columbus, Ohio, USA.
5Department of Surgical Oncology, MD Anderson Cancer Center, Houston, Texas, USA.
6Department of Medicine, University of Pittsburgh, Pittsburgh, Pennsylvania, USA.
7Department of Pathology, George Washington University, Washington, DC, USA.
8Department of Pathology and Laboratory Medicine, Northwell Health, Manhasset, New York, USA.
9Institute for Bioelectronic Medicine, Feinstein Institutes for Medical Research and Cold Spring Harbor Laboratory, Department of Medicine, Division of Gastroenterology and Hepatology, Northwell Health, Manhasset, New York, USA.
10Division of Hepatology, Department of Medicine, Northwell Health, Manhasset, New York, USA.
Address correspondence to: Hai Huang, Center for Immunology and Inflammation, Feinstein Institutes for Medical Research, 350 Community Drive, Manhasset, New York 11030, USA. Email: hhuang10@northwell.edu.
Authorship note: HZ and XH contributed equally to this work.
Find articles by Bharti, V. in: PubMed | Google Scholar
1Department of Surgery, School of Medicine, University of Virginia, Charlottesville, Virginia, USA.
2Center for Immunology and Inflammation, Institute of Translational Research, Feinstein Institutes for Medical Research, Manhasset, New York, USA.
3Department of Surgery, Northwell Health, Manhasset, New York, USA.
4Department of Pathology, The Ohio State University, Columbus, Ohio, USA.
5Department of Surgical Oncology, MD Anderson Cancer Center, Houston, Texas, USA.
6Department of Medicine, University of Pittsburgh, Pittsburgh, Pennsylvania, USA.
7Department of Pathology, George Washington University, Washington, DC, USA.
8Department of Pathology and Laboratory Medicine, Northwell Health, Manhasset, New York, USA.
9Institute for Bioelectronic Medicine, Feinstein Institutes for Medical Research and Cold Spring Harbor Laboratory, Department of Medicine, Division of Gastroenterology and Hepatology, Northwell Health, Manhasset, New York, USA.
10Division of Hepatology, Department of Medicine, Northwell Health, Manhasset, New York, USA.
Address correspondence to: Hai Huang, Center for Immunology and Inflammation, Feinstein Institutes for Medical Research, 350 Community Drive, Manhasset, New York 11030, USA. Email: hhuang10@northwell.edu.
Authorship note: HZ and XH contributed equally to this work.
Find articles by Onuma, A. in: PubMed | Google Scholar
1Department of Surgery, School of Medicine, University of Virginia, Charlottesville, Virginia, USA.
2Center for Immunology and Inflammation, Institute of Translational Research, Feinstein Institutes for Medical Research, Manhasset, New York, USA.
3Department of Surgery, Northwell Health, Manhasset, New York, USA.
4Department of Pathology, The Ohio State University, Columbus, Ohio, USA.
5Department of Surgical Oncology, MD Anderson Cancer Center, Houston, Texas, USA.
6Department of Medicine, University of Pittsburgh, Pittsburgh, Pennsylvania, USA.
7Department of Pathology, George Washington University, Washington, DC, USA.
8Department of Pathology and Laboratory Medicine, Northwell Health, Manhasset, New York, USA.
9Institute for Bioelectronic Medicine, Feinstein Institutes for Medical Research and Cold Spring Harbor Laboratory, Department of Medicine, Division of Gastroenterology and Hepatology, Northwell Health, Manhasset, New York, USA.
10Division of Hepatology, Department of Medicine, Northwell Health, Manhasset, New York, USA.
Address correspondence to: Hai Huang, Center for Immunology and Inflammation, Feinstein Institutes for Medical Research, 350 Community Drive, Manhasset, New York 11030, USA. Email: hhuang10@northwell.edu.
Authorship note: HZ and XH contributed equally to this work.
Find articles by Shen, C. in: PubMed | Google Scholar
1Department of Surgery, School of Medicine, University of Virginia, Charlottesville, Virginia, USA.
2Center for Immunology and Inflammation, Institute of Translational Research, Feinstein Institutes for Medical Research, Manhasset, New York, USA.
3Department of Surgery, Northwell Health, Manhasset, New York, USA.
4Department of Pathology, The Ohio State University, Columbus, Ohio, USA.
5Department of Surgical Oncology, MD Anderson Cancer Center, Houston, Texas, USA.
6Department of Medicine, University of Pittsburgh, Pittsburgh, Pennsylvania, USA.
7Department of Pathology, George Washington University, Washington, DC, USA.
8Department of Pathology and Laboratory Medicine, Northwell Health, Manhasset, New York, USA.
9Institute for Bioelectronic Medicine, Feinstein Institutes for Medical Research and Cold Spring Harbor Laboratory, Department of Medicine, Division of Gastroenterology and Hepatology, Northwell Health, Manhasset, New York, USA.
10Division of Hepatology, Department of Medicine, Northwell Health, Manhasset, New York, USA.
Address correspondence to: Hai Huang, Center for Immunology and Inflammation, Feinstein Institutes for Medical Research, 350 Community Drive, Manhasset, New York 11030, USA. Email: hhuang10@northwell.edu.
Authorship note: HZ and XH contributed equally to this work.
Find articles by Lou, D. in: PubMed | Google Scholar
1Department of Surgery, School of Medicine, University of Virginia, Charlottesville, Virginia, USA.
2Center for Immunology and Inflammation, Institute of Translational Research, Feinstein Institutes for Medical Research, Manhasset, New York, USA.
3Department of Surgery, Northwell Health, Manhasset, New York, USA.
4Department of Pathology, The Ohio State University, Columbus, Ohio, USA.
5Department of Surgical Oncology, MD Anderson Cancer Center, Houston, Texas, USA.
6Department of Medicine, University of Pittsburgh, Pittsburgh, Pennsylvania, USA.
7Department of Pathology, George Washington University, Washington, DC, USA.
8Department of Pathology and Laboratory Medicine, Northwell Health, Manhasset, New York, USA.
9Institute for Bioelectronic Medicine, Feinstein Institutes for Medical Research and Cold Spring Harbor Laboratory, Department of Medicine, Division of Gastroenterology and Hepatology, Northwell Health, Manhasset, New York, USA.
10Division of Hepatology, Department of Medicine, Northwell Health, Manhasset, New York, USA.
Address correspondence to: Hai Huang, Center for Immunology and Inflammation, Feinstein Institutes for Medical Research, 350 Community Drive, Manhasset, New York 11030, USA. Email: hhuang10@northwell.edu.
Authorship note: HZ and XH contributed equally to this work.
Find articles by Latham, P. in: PubMed | Google Scholar
1Department of Surgery, School of Medicine, University of Virginia, Charlottesville, Virginia, USA.
2Center for Immunology and Inflammation, Institute of Translational Research, Feinstein Institutes for Medical Research, Manhasset, New York, USA.
3Department of Surgery, Northwell Health, Manhasset, New York, USA.
4Department of Pathology, The Ohio State University, Columbus, Ohio, USA.
5Department of Surgical Oncology, MD Anderson Cancer Center, Houston, Texas, USA.
6Department of Medicine, University of Pittsburgh, Pittsburgh, Pennsylvania, USA.
7Department of Pathology, George Washington University, Washington, DC, USA.
8Department of Pathology and Laboratory Medicine, Northwell Health, Manhasset, New York, USA.
9Institute for Bioelectronic Medicine, Feinstein Institutes for Medical Research and Cold Spring Harbor Laboratory, Department of Medicine, Division of Gastroenterology and Hepatology, Northwell Health, Manhasset, New York, USA.
10Division of Hepatology, Department of Medicine, Northwell Health, Manhasset, New York, USA.
Address correspondence to: Hai Huang, Center for Immunology and Inflammation, Feinstein Institutes for Medical Research, 350 Community Drive, Manhasset, New York 11030, USA. Email: hhuang10@northwell.edu.
Authorship note: HZ and XH contributed equally to this work.
Find articles by Crawford, J. in: PubMed | Google Scholar
1Department of Surgery, School of Medicine, University of Virginia, Charlottesville, Virginia, USA.
2Center for Immunology and Inflammation, Institute of Translational Research, Feinstein Institutes for Medical Research, Manhasset, New York, USA.
3Department of Surgery, Northwell Health, Manhasset, New York, USA.
4Department of Pathology, The Ohio State University, Columbus, Ohio, USA.
5Department of Surgical Oncology, MD Anderson Cancer Center, Houston, Texas, USA.
6Department of Medicine, University of Pittsburgh, Pittsburgh, Pennsylvania, USA.
7Department of Pathology, George Washington University, Washington, DC, USA.
8Department of Pathology and Laboratory Medicine, Northwell Health, Manhasset, New York, USA.
9Institute for Bioelectronic Medicine, Feinstein Institutes for Medical Research and Cold Spring Harbor Laboratory, Department of Medicine, Division of Gastroenterology and Hepatology, Northwell Health, Manhasset, New York, USA.
10Division of Hepatology, Department of Medicine, Northwell Health, Manhasset, New York, USA.
Address correspondence to: Hai Huang, Center for Immunology and Inflammation, Feinstein Institutes for Medical Research, 350 Community Drive, Manhasset, New York 11030, USA. Email: hhuang10@northwell.edu.
Authorship note: HZ and XH contributed equally to this work.
Find articles by Chen, K. in: PubMed | Google Scholar
1Department of Surgery, School of Medicine, University of Virginia, Charlottesville, Virginia, USA.
2Center for Immunology and Inflammation, Institute of Translational Research, Feinstein Institutes for Medical Research, Manhasset, New York, USA.
3Department of Surgery, Northwell Health, Manhasset, New York, USA.
4Department of Pathology, The Ohio State University, Columbus, Ohio, USA.
5Department of Surgical Oncology, MD Anderson Cancer Center, Houston, Texas, USA.
6Department of Medicine, University of Pittsburgh, Pittsburgh, Pennsylvania, USA.
7Department of Pathology, George Washington University, Washington, DC, USA.
8Department of Pathology and Laboratory Medicine, Northwell Health, Manhasset, New York, USA.
9Institute for Bioelectronic Medicine, Feinstein Institutes for Medical Research and Cold Spring Harbor Laboratory, Department of Medicine, Division of Gastroenterology and Hepatology, Northwell Health, Manhasset, New York, USA.
10Division of Hepatology, Department of Medicine, Northwell Health, Manhasset, New York, USA.
Address correspondence to: Hai Huang, Center for Immunology and Inflammation, Feinstein Institutes for Medical Research, 350 Community Drive, Manhasset, New York 11030, USA. Email: hhuang10@northwell.edu.
Authorship note: HZ and XH contributed equally to this work.
Find articles by Vilgelm, A. in: PubMed | Google Scholar
1Department of Surgery, School of Medicine, University of Virginia, Charlottesville, Virginia, USA.
2Center for Immunology and Inflammation, Institute of Translational Research, Feinstein Institutes for Medical Research, Manhasset, New York, USA.
3Department of Surgery, Northwell Health, Manhasset, New York, USA.
4Department of Pathology, The Ohio State University, Columbus, Ohio, USA.
5Department of Surgical Oncology, MD Anderson Cancer Center, Houston, Texas, USA.
6Department of Medicine, University of Pittsburgh, Pittsburgh, Pennsylvania, USA.
7Department of Pathology, George Washington University, Washington, DC, USA.
8Department of Pathology and Laboratory Medicine, Northwell Health, Manhasset, New York, USA.
9Institute for Bioelectronic Medicine, Feinstein Institutes for Medical Research and Cold Spring Harbor Laboratory, Department of Medicine, Division of Gastroenterology and Hepatology, Northwell Health, Manhasset, New York, USA.
10Division of Hepatology, Department of Medicine, Northwell Health, Manhasset, New York, USA.
Address correspondence to: Hai Huang, Center for Immunology and Inflammation, Feinstein Institutes for Medical Research, 350 Community Drive, Manhasset, New York 11030, USA. Email: hhuang10@northwell.edu.
Authorship note: HZ and XH contributed equally to this work.
Find articles by Mishra, L. in: PubMed | Google Scholar
1Department of Surgery, School of Medicine, University of Virginia, Charlottesville, Virginia, USA.
2Center for Immunology and Inflammation, Institute of Translational Research, Feinstein Institutes for Medical Research, Manhasset, New York, USA.
3Department of Surgery, Northwell Health, Manhasset, New York, USA.
4Department of Pathology, The Ohio State University, Columbus, Ohio, USA.
5Department of Surgical Oncology, MD Anderson Cancer Center, Houston, Texas, USA.
6Department of Medicine, University of Pittsburgh, Pittsburgh, Pennsylvania, USA.
7Department of Pathology, George Washington University, Washington, DC, USA.
8Department of Pathology and Laboratory Medicine, Northwell Health, Manhasset, New York, USA.
9Institute for Bioelectronic Medicine, Feinstein Institutes for Medical Research and Cold Spring Harbor Laboratory, Department of Medicine, Division of Gastroenterology and Hepatology, Northwell Health, Manhasset, New York, USA.
10Division of Hepatology, Department of Medicine, Northwell Health, Manhasset, New York, USA.
Address correspondence to: Hai Huang, Center for Immunology and Inflammation, Feinstein Institutes for Medical Research, 350 Community Drive, Manhasset, New York 11030, USA. Email: hhuang10@northwell.edu.
Authorship note: HZ and XH contributed equally to this work.
Find articles by Tsung, A. in: PubMed | Google Scholar
1Department of Surgery, School of Medicine, University of Virginia, Charlottesville, Virginia, USA.
2Center for Immunology and Inflammation, Institute of Translational Research, Feinstein Institutes for Medical Research, Manhasset, New York, USA.
3Department of Surgery, Northwell Health, Manhasset, New York, USA.
4Department of Pathology, The Ohio State University, Columbus, Ohio, USA.
5Department of Surgical Oncology, MD Anderson Cancer Center, Houston, Texas, USA.
6Department of Medicine, University of Pittsburgh, Pittsburgh, Pennsylvania, USA.
7Department of Pathology, George Washington University, Washington, DC, USA.
8Department of Pathology and Laboratory Medicine, Northwell Health, Manhasset, New York, USA.
9Institute for Bioelectronic Medicine, Feinstein Institutes for Medical Research and Cold Spring Harbor Laboratory, Department of Medicine, Division of Gastroenterology and Hepatology, Northwell Health, Manhasset, New York, USA.
10Division of Hepatology, Department of Medicine, Northwell Health, Manhasset, New York, USA.
Address correspondence to: Hai Huang, Center for Immunology and Inflammation, Feinstein Institutes for Medical Research, 350 Community Drive, Manhasset, New York 11030, USA. Email: hhuang10@northwell.edu.
Authorship note: HZ and XH contributed equally to this work.
Find articles by
Deng, M.
in:
PubMed
|
Google Scholar
|

1Department of Surgery, School of Medicine, University of Virginia, Charlottesville, Virginia, USA.
2Center for Immunology and Inflammation, Institute of Translational Research, Feinstein Institutes for Medical Research, Manhasset, New York, USA.
3Department of Surgery, Northwell Health, Manhasset, New York, USA.
4Department of Pathology, The Ohio State University, Columbus, Ohio, USA.
5Department of Surgical Oncology, MD Anderson Cancer Center, Houston, Texas, USA.
6Department of Medicine, University of Pittsburgh, Pittsburgh, Pennsylvania, USA.
7Department of Pathology, George Washington University, Washington, DC, USA.
8Department of Pathology and Laboratory Medicine, Northwell Health, Manhasset, New York, USA.
9Institute for Bioelectronic Medicine, Feinstein Institutes for Medical Research and Cold Spring Harbor Laboratory, Department of Medicine, Division of Gastroenterology and Hepatology, Northwell Health, Manhasset, New York, USA.
10Division of Hepatology, Department of Medicine, Northwell Health, Manhasset, New York, USA.
Address correspondence to: Hai Huang, Center for Immunology and Inflammation, Feinstein Institutes for Medical Research, 350 Community Drive, Manhasset, New York 11030, USA. Email: hhuang10@northwell.edu.
Authorship note: HZ and XH contributed equally to this work.
Find articles by Huang, H. in: PubMed | Google Scholar
Published September 22, 2026 - More info
JCI Insight. 2026;11(18):e203495. https://doi.org/10.1172/jci.insight.203495.
© 2026 Zhang et al. This work is licensed under the Creative Commons Attribution 4.0 International License. To view a copy of this license, visit http://creativecommons.org/licenses/by/4.0/.

-
Results
Integrated single-cell multiomics reveals spatially organized immune remodeling after liver I/R.
To define how surgical stress reshapes the hepatic immune microenvironment, we applied an integrated multiomics strategy combining high-dimensional spectral flow cytometry, scRNA-seq, and spatial transcriptomics in a murine model (8) of liver I/R injury (Figure 1A). As expected, I/R resulted in marked hepatocellular injury, evidenced by elevated serum alanine aminotransferase and extensive necrosis (Supplemental Figure 1, A and B; supplemental material available online with this article; https://doi.org/10.1172/jci.insight.203495DS1).
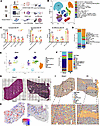 Figure 1
A single-cell multiomics atlas of murine liver before and after liver I/R. (A) Schematic diagram illustrating the single-cell multiomics atlas of murine liver before and after liver I/R. (B) Global UMAP of FlowSOM data derived from FACS-sorted CD45+ hepatic immune cells. (C) Quantification of hepatic immune cell populations showing significantly increased, decreased, or unchanged subsets following I/R. (D) Stacked bar graph depicting the proportions of hepatic immune cell populations in sham and I/R livers. (E) UMAP of scRNA-seq data showing CD45+ immune cell types extracted from the global UMAP space in sham and I/R samples. (F) Stacked bar graph showing the proportional distribution of immune cell types in sham and I/R livers. (G) Representative histological zonation of liver sections from sham and I/R mice used for spatial transcriptomics. Portal tracts (PT) are indicated, with the base of the “PT” label marking the precise location of the tract. Scale bars: 100 μm. (H) Identification of liver zonation in spatial transcriptomics specimens based on expression of Cyp2f2 and Cyp2e1. (I) Spatial scatter-pie plot in which each spot is represented as a pie chart indicating the predicted proportion of constituent cell types. Data represent the mean ± SEM. *P < 0.05, **P < 0.01, ***P < 0.001, ****P < 0.0001, by 2-tailed, unpaired t test (C).
High-dimensional spectral flow cytometry of CD45+ hepatic immune cells stained with a comprehensive immune marker panel (15) revealed substantial remodeling of the immune landscape following I/R. Based on a multivariate t-mixture model and FlowSOM (16) clustering algorithm and clustered heatmap analysis, unbiased clustering identified major myeloid and lymphoid populations (Figure 1B and Supplemental Figure 1, C–E). Quantitative analysis demonstrated a pronounced expansion of CD11b+Gr-1+ neutrophils, Ly6C+ monocytes, NK cells, h CD4+ and CD8+ T cells after I/R, accompanied by a significant reduction in B cells and macrophages, including infiltrating macrophages and hepatic resident macrophages, Kupffer cells (KCs) (Figure 1, C and D). In contrast, dendritic cell and NKT cell numbers were unchanged after liver I/R.
To resolve transcriptional changes at single-cell resolution, we integrated newly generated scRNA-seq data with our previously published scRNA-seq dataset (Gene Expression Omnibus GSE173429, ref. 8) with newly performed animal experiments using the Harmony algorithm (17) to minimize experimental batch effects. In addition, to avoid unexpected noise and expression artifacts by dissociation, ribosomal genes (1,253 genes) were controlled and excluded (18). All 38,317 cells were clustered into 32 discrete clusters (Supplemental Figure 2, A and B). After qualitative filtering and exclusion of cells negative for Ptprc (CD45) (liver sinusoidal endothelial cells [LSECs], n = 4,067, clusters 9, 14, and 15; and hepatocytes, n = 264, cluster 28), 33,986 CD45+ immune cells were analyzed and classified into major immune subsets based on established feature genes (8): KCs, conventional dendritic cells (cDCs), plasmacytoid dendritic cells (pDCs), infiltrating monocytes, infiltrating macrophages, neutrophils, B cells, CD3+ T cells (CD4+ and CD8+ T cells), NK cells, and NKT cells (Figure 1E and Supplemental Figure 2C). Consistent with our flow cytometry findings, neutrophils and infiltrating monocytes represented the most prominently expanded populations after I/R (Figure 1F). The proportion of all other immune cells decreased, indicating that I/R injury not only caused immune cell infiltration into the liver but also modulated the transcriptomic landscape of the hepatic immune microenvironment (Figure 1F and Supplemental Figure 2D).
Given the highly zonated architecture of the liver, we next used spatial transcriptomics (ST) (19) to determine how immune cells redistribute within injured tissue. Visium-based (Visium Spatial, 10x Genomics) (20) profiling of sham and I/R liver sections (n = 2 per group) enabled spatial mapping of transcriptomic signatures across lobular zones (Figure 1, G and H, and Supplemental Figure 2E). To identify the zonation of the ST specimen, we used the specific expression of well-defined zonation markers, Cyp2f2 and Cyp2e1 (10), to indicate the periportal zone and pericentral zone, respectively (Figure 1H). Our ST zonation showed results consistent with histological analysis on hematoxylin and eosin (H&E) staining slides, comparing favorably with inferred zonation based on localization of portal tracts on the H&E section images.
We further integrated our annotated scRNA-seq dataset to sequence the transcriptome of FACS-CD45+-selected hepatic leukocytes from sham versus I/R mice with spot-based clustering, using spot deconvolution with ANCHOR (21) to further annotate clusters in the identified main histological areas of the liver with their respective cell-type abundances within each spot (Figure 1I). After quality control, we obtained a total of 4,769 spots from the sham group and 4,912 spots from the I/R group (average of 2,420 spots per specimen). As each Visium ST spot resolution is limited to 55 μm with each group of cells captured, we leveraged our annotated scRNA-seq data to further deconvolute each ST spot with estimated cell-type compositions to increase resolution (Figure 1I and Supplemental Figure 2F). Our cell-type composition deconvolution data revealed that the evenly distributed hepatic immune cells in sham livers were dramatically redistributed after liver I/R. A marked abundance of neutrophils was found in the necrotic area of the I/R liver, illustrated in Figure 1I. This approach revealed that neutrophils became highly enriched in necrotic pericentral zones, while other immune populations were reduced or displaced following I/R.
Transcriptional landscape of hepatic immune subsets following liver I/R.
To comprehensively characterize how distinct hepatic immune cell populations respond to surgical stress, we performed subset-level transcriptional analyses across adaptive and innate cells in the hepatic immune microenvironments using scRNA-seq and ST data. Within CD3+ T cells, total CD4+ and CD8+ T cell numbers did not significantly change following I/R (Figure 1, C and F). Subset-level analysis of CD4+ T cells identified 6 transcriptional subpopulations based on differentially expressed genes (DEGs), including T helper 1 (Th1) effector/memory cell, Th2, regulatory T cell (Treg), IFN-stimulated, and Hsp+ subsets (Supplemental Figure 3, A–C). Th1 memory and Th1 effector subsets were enriched in sham livers, whereas Th2 subsets were more prevalent after I/R, resulting in a decreased Th1/Th2 ratio (Supplemental Figure 3C). Differential expression analysis revealed increased Txnip, S100a9, Ctla2a, Ifngr1, Ccl5, and Rgs1 and reduced Cd52 expression in I/R–associated CD4+ T cells (Supplemental Figure 3D). Both Gene Ontology biological process (GO-BP) and Kyoto Encyclopedia of Genes and Genomes (KEGG) pathway analysis indicated modest enrichment of T cell differentiation and IL-17 signaling pathways, alongside suppression of activation-associated processes (Supplemental Figure 3D). ST analysis showed weak and evenly distributed CD4+ cells across lobular zones in both conditions (Supplemental Figure 3E). CD8+ T cells formed 3 transcriptional subclusters without significant changes in overall abundance after I/R (Supplemental Figure 4A). Within the NKT compartment, 3 subtypes were identified; both type 1 and type 2 NKT cells (22) decreased after I/R, whereas an S100a8/a9+ subpopulation increased (Supplemental Figure 4B). Both CD8+ T cells and NKT cells exhibited upregulation of S100a8 and S100a9 in I/R livers (Supplemental Figure 4, C and D), and KEGG analysis demonstrated enrichment of IL-17 signaling pathways among upregulated genes (Supplemental Figure 4, E and G). ST mapping revealed limited redistribution of CD8+ T cells and NKT cells, with only sparse localization near pericentral regions following I/R (Supplemental Figure 4, F and H). Together, these findings indicate that while CD3+ T cell abundance remains largely stable during early reperfusion, subset-level transcriptional changes occur without marked spatial reorganization.
Total B-cell abundance was altered, with scRNA-seq revealing changes in the composition of specific B-cell subsets. We characterized 8 distinct subpopulations of B cells among 11 subclusters — naive, memory, follicular, activated, B1, antibody-secreting cells/plasma cells, transitional, and antigen-presenting B cells — based on their canonical feature genes (23). Memory and follicular B cells were enriched in sham livers, whereas activated B cells predominated after I/R (Supplemental Figure 5, A–C). I/R–associated activated B cells upregulated Cd83, Junb, Satb1, and Cxcr4 and showed reduced expression of Cd79a and Cd79b, which encode 2 subunits (Igα and Igβ) of the B cell receptor (BCR) complex (24), suggesting impairment of B cell memory development (Supplemental Figure 5D). KEGG pathway analysis indicated decreased BCR signaling but enhanced TNF and IL-17 signaling, along with enrichment of light zone–associated gene signatures (Supplemental Figure 5E). ST analysis demonstrated sparse periportal localization in sham livers and comparable periportal and mid-lobular distribution after I/R, without enrichment in necrotic regions (Supplemental Figure 5F).
scRNA-seq identified 3 NK subsets (NK1–NK3) across 6 subclusters, in line with established feature markers (25) (Supplemental Figure 6, A–C). NK3 cells were predominantly derived from sham livers, whereas NK1 and NK2 subsets were enriched following I/R, indicating altered NK composition (Supplemental Figure 6C). I/R–associated NK1 and NK2 cells upregulated Il18rap, Tnfaip3, Ptprc, and Il7r, with GO analysis showing enrichment of lymphocyte differentiation and cytokine-mediated signaling pathways (Supplemental Figure 6D). ST analysis revealed comparable lobular distribution between sham and I/R conditions without enrichment in necrotic regions (Supplemental Figure 6E).
Conventional dendritic cells (cDCs) were reduced following I/R and segregated into 7 transcriptional subsets (26, 27): cDC1, cDC2A, cDC2B, cDC3, inflammatory cDC2, Ccr7+, and Ifit+ dendritic cells (Supplemental Figure 7, A–C). Inflammatory cDC2, cDC2B, and cDC3 populations were enriched in I/R livers and upregulated Tgfbi, Nfkbia, Ccl6, Cxcl2, Ccr1, and Ccr2 (Supplemental Figure 7D). Plasmacytoid dendritic cells (pDCs) were also reduced and distributed across 5 subclusters, with I/R–associated cells enriched in Il7r+ progenitor-derived populations and showing increased Cd2ap expression (Supplemental Figure 7, E and F). GO pathway analysis demonstrated enrichment of leukocyte chemotaxis and inflammatory signaling, alongside suppression of antigen presentation pathways with concurrent TNF and IL-17 pathway enrichment (Supplemental Figure 7G). ST analysis showed broad dendritic cell distribution in sham livers but relative exclusion from necrotic regions after I/R (Supplemental Figure 7H).
scRNA-seq revealed marked infiltration of monocytes following I/R, consistent with flow cytometry findings (Supplemental Figure 8A). Classical, non-classical, and intermediate monocyte subsets were identified, along with a dendritic cell–producing monocyte (DCMo) (28) population characterized by H2-Aa, H2-Ab1, H2-Eb1, and Cd74 expression, which was expanded in I/R livers (Supplemental Figure 8, A–C). I/R–associated monocytes upregulated Il1b, Ccl3, Cxcl2, Ccr1, and Ccr2, with reduced Cd74 and Cxcr4 expression (Supplemental Figure 8D). Infiltrating macrophages (Adgre1hiClec4flo) (8) were less abundant with cluster 2 enriched in I/R livers (Supplemental Figure 8E), displaying similar inflammatory signatures with upregulation of Cd14, Tnfaip3, Ccl4, Ccl9, Cxcl2, and Cxcl10 (Supplemental Figure 8F). GO-BP pathway analyses for infiltrating monocytes and macrophage populations indicated enrichment of myeloid cell differentiation/migration and innate immune activation pathways, respectively, accompanied by suppression of antigen presentation programs in both cell types (Supplemental Figure 8, G and H). ST analysis demonstrated broad distribution of infiltrating monocytes and macrophages after I/R without preferential accumulation in necrotic regions (Supplemental Figure 8, I and J). A small population of basophils (n = 31, Fcer1a, Mcpt8, Cd9) (29) was also detected following I/R, indicating broader innate immune activation, although their relative abundance remained limited (Supplemental Figure 8C). Collectively, integrated single-cell and spatial analyses demonstrate that liver I/R induces coordinated but subset-specific transcriptional changes across adaptive and innate immune compartments.
KCs exhibit inflammatory activation and metabolic suppression following liver I/R.
Resident KCs exhibited substantial transcriptional heterogeneity after liver I/R (Supplemental Figure 9A). Based on the DEGs of each subset (Supplemental Figure 9B) and established KCs subtypes (30), we characterized 8 subtypes of KCs from a total of 14 subclusters — KC2 (31) (Esam+), MARCO+ (Marco+; macrophage receptor with collagenous structure), resident (Res), lipid-associated macrophage–like (LAM-like), liver capsule macrophage (LCM) and central vein (CV) Marco+, Trem2+, and Ifit+ — in the liver (Figure 2A). Most of the resident KCs were enriched in sham livers, whereas MARCO+ subsets predominated in I/R livers (Figure 2A and Supplemental Figure 9C). I/R–associated MARCO+ KCs were enriched in gene expression related to proinflammatory responses, adhesion, and infiltration (Marco, Cd14, Cd36, Vcam1, S100a8, S100a9, Ccl6, and Cxcl2) (Figure 2B). GO-BP analysis revealed that I/R–associated MARCO+ KCs were enriched in immune response–activating/regulating signaling pathways but showed suppressed mitochondrial ATP synthesis, aerobic respiration, and oxidative phosphorylation (OXPHOS) pathways, indicating that liver I/R promoted metabolic reprogramming in KCs (Figure 2C). KEGG pathway enrichment analysis showed enrichment in proteasome, lysosome, and phagosome signaling pathways (Figure 2D). Notably, both GO-BP and KEGG analysis revealed a strong suppression of OXPHOS signal pathway in KCs after liver I/R. ST analysis revealed that KCs were broadly distributed across the sham liver tissue and absent from necrotic zones of I/R livers, despite their overall transcriptional activation (Figure 2E). Together, these data indicate that liver I/R induces marked transcriptional shifts within resident KCs, characterized by enhanced inflammatory signaling and coordinated suppression of mitochondrial oxidative metabolism.
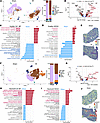 Figure 2
Landscape of KCs and neutrophils in sham and I/R liver. (A) UMAP plots show distinct KC subtypes in sham and I/R liver. (B) Volcano plot showing DEGs in I/R–associated KCs compared with sham. (C) GO biological process pathway enrichment analysis of DEGs in I/R–associated KCs compared with sham. (D) KEGG pathway enrichment analysis of DEGs in I/R–associated KCs compared with sham. (E) Spatial transcriptomics analysis of KCs in sham and I/R mouse livers. (F) UMAP plots showing distinct neutrophil subtypes in sham and I/R liver. (G) Volcano plot showing DEGs in I/R–associated neutrophils compared with sham. (H) Biological process pathway enrichment analysis of DEGs in I/R–associated neutrophils compared with sham. (I) KEGG pathway enrichment analysis of DEGs in I/R–associated neutrophils compared with sham. (J) Spatial transcriptomics analysis of neutrophils in sham and I/R mouse livers.
Neutrophils accumulate in necrotic areas and exhibit inflammatory activation after liver I/R.
Neutrophils represented the most markedly expanded myeloid compartment following liver I/R. Similarly to infiltrating monocytes, nearly all captured neutrophils originated from I/R mice, forming 5 transcriptionally distinct clusters (Supplemental Figure 9D). Subset analysis identified Ccl4+, Mmp8+, Ifit+, Stfa+, and Cd74+ neutrophils, consistent with previously reported inflammatory phenotypes (18) (Figure 2F and Supplemental Figure 9). Notably, the Stfa+ subset (cluster 3) was characterized by high expression of Stefin A family genes (Stfa1, Stfa2, Stfa2l1, BC100530), a signature associated with bone marrow–derived neutrophil expansion in severe infection models, including SARS-CoV-2 (32, 33) (Supplemental Figure 9E). Neutrophils in I/R livers upregulated numerous inflammatory and danger-response genes (Cd14, Casp4, Thbs1, Il1r2, Ccl3, Cxcl2, Cxcl3) (Figure 2G). GO-BP enrichment analysis highlighted cytokine signaling, ROS metabolism, innate immune activation, and leukocyte migration (Figure 2H). KEGG analysis showed increased activation of NF-κB, TNF, IL-17, and cytokine–cytokine receptor interaction pathways, further supporting a robust proinflammatory phenotype (Figure 2I). These transcriptional programs underscore the central role of infiltrating neutrophils as key effectors of sterile liver inflammation during I/R. ST analysis revealed a distinct localization pattern for neutrophils compared with other immune cells. In I/R livers, neutrophils were uniquely localized and highly enriched within necrotic areas, in contrast to KCs and monocytes, which were largely excluded from these zones (Figure 2J). This spatial segregation suggests direct engagement of neutrophils with injured parenchyma and positions them uniquely within the inflammatory niche generated after reperfusion.
Neutrophil-KC interaction is selectively enriched via TSP-1/CD36 signaling after liver I/R.
To determine whether liver I/R alters intercellular crosstalk within the hepatic immune microenvironment, we performed cell-cell interaction analysis using CellChat (34). Both global communication strength and number of predicted interactions were markedly increased following I/R injury compared with sham (Supplemental Figure 10A). Ligand-receptor analysis revealed that among all enriched pathways, thrombospondin (THBS) signaling emerged as the most strongly upregulated intercellular signaling axis after I/R and was predominantly initiated from neutrophils and infiltrating monocytes to other immune cells in the liver (Supplemental Figure 10 , B and C). Given that KCs represent the largest immune population under homeostasis and neutrophils become predominant after I/R (Figure 1, E and F), we focused on these two cell types. Notably, the interactions of KCs with most other immune cell types decreased after I/R, besides infiltrating monocytes and neutrophils. I/R markedly augmented the interactions of neutrophils with other cell types, but not with CD4+ and CD8+ T cells (Figure 3A and Supplemental Figure 10D). THBS signaling emerged as the most enriched neutrophil-derived signaling pathway to all other immune cells following I/R (Supplemental Figure 10E) and was also the top upregulated signaling pathway from neutrophils to KCs (Figure 3B). Specifically, among thrombospondin-1 (TSP-1) interactions with CD47, CD36, and SDC4, TSP-1/CD36 signaling was selectively and uniquely augmented in neutrophil-to-KC interactions (Figure 3C).
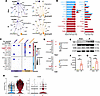 Figure 3
Neutrophil-KC interaction is selectively enriched via TSP-1/CD36 signaling after liver I/R. (A) Circle plot showing predicted outgoing cell-cell interactions from KCs and neutrophils to other immune cell subsets in sham (top) and I/R (bottom) liver using CellChat analysis. (B) Bar graph showing the relative information flow of ligand-receptor interactions in neutrophil-to-KC communication in sham and I/R liver. (C) Bubble plot showing upregulated source-to-target signaling pathways from KCs (left) or neutrophils (right) in sham (bottom) and I/R (top) liver. (D) Dot plot showing Thbs1 and Cd36 expression in hepatic immune cells. (E) Western blot showing TSP-1 and CD36 expression in sham and I/R liver. (F) ELISA showing TSP-1 serum levels from sham and I/R mice. (G) Flow cytometry showing frequencies of CD36+ KCs from sham and I/R liver tissues. (H) Violin plot showing THBS1 expression in neutrophils and CD36 expression in KCs in post-reperfusion (PR) patient samples compared with pre-procurement (PP) ones. Data represent the mean ± SEM. **P < 0.01, by 2-tailed, unpaired t test (F and G).
Consistent with these predictions, Thbs1, which encodes TSP-1, was predominantly expressed in both infiltrating monocytes and neutrophils (Figure 3D) and also dramatically increased in all subtypes of neutrophils following liver I/R (Supplemental Figure 10F). In parallel, Cd36, a scavenger receptor involved in lipid metabolism and cellular signaling (35) and a receptor of TSP-1 (36), exhibited the highest expression among hepatic immune populations within KCs (Figure 3D) and was significantly enriched in I/R–associated KC subsets (Supplemental Figure 10F). Transcriptomic findings were supported by significantly increased serum levels of TSP-1 (Figure 3E) and enhanced protein expression in the infiltrated neutrophils obtained from ischemic liver (Figure 3F). Consistently, elevated frequencies of CD36+ KCs were observed by flow cytometry after liver I/R (Figure 3G and Supplemental Figure 10G).
To assess translational relevance, we analyzed a publicly available scRNA-seq dataset (GSE171539) obtained from human liver transplantation (37) and evaluated the interaction between neutrophils and KCs before and after organ reperfusion (Supplemental Figure 11, A–C). Expression of THBS1 in neutrophils and CD36 in KCs was significantly upregulated in post-reperfusion (PR) samples compared with pre-procurement ones (Figure 3H). Collectively, these transcriptional, protein-level, and cross-species data identify neutrophil-derived TSP-1 and KC-expressed CD36 as a selectively enriched signaling axis during liver I/R, suggesting a mechanism through which infiltrating neutrophils may modulate KC functional states within the injured hepatic microenvironment.
Spatial transcriptomics reveals enhanced neutrophil-KC interaction after liver I/R.
To determine whether the predicted neutrophil-KC interaction was also reflected in the hepatic spatial architecture, we interrogated our ST data by evaluating joint expression of KCs and neutrophils. In sham livers, neutrophils and KCs exhibited relatively dispersed and evenly distributed colocalization (Figure 4A). Notably, distribution of the joint expression scores of KCs and neutrophils in the liver of sham and I/R mice revealed a marked upward shift in the expression signature (score > 0.4) in the I/R group compared with the sham control, indicating an enhanced immune cell crosstalk after I/R (Figure 4B). To quantify the spatial dependency, we applied MISTy (38) analysis, defining 3 levels of spatial proximity: intra-spot (colocalization), juxta (immediate neighborhood, radius = 1 spot), and para (extended neighborhood, radius = 5 spots). Broader spatial analysis using MISTy revealed enhanced immune cell spatial dependencies, particularly in the juxta and para regions, after I/R (Supplemental Figure 12A). I/R markedly increased spatial codependency between KCs and neutrophils across all spatial scales in comparison with sham controls, in alignment with our CellChat results (Figure 4C). Spatial colocalization analysis further demonstrated overlap of Thbs1 with the neutrophil marker S100a8 and of Cd36 with the KC marker Clec4f in the I/R livers, supporting activation of the TSP-1/CD36 signaling axis in situ (Figure 4D).
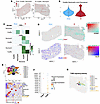 Figure 4
Spatial transcriptomics reveals enhanced neutrophil-KC interaction after liver I/R. (A) Spatial distribution of niches defined by joint KC and neutrophil marker expression in sham (left) and I/R (right) liver tissues. (B) Violin plot showing KC-neutrophil joint expression. (C) Heatmap analysis using MISTy to evaluate spatial dependencies between KCs and neutrophils within 3 neighborhood contexts: colocalization within the same spot (Intra), immediate neighborhood (Juxta), and extended neighborhood (Para). (D) Spatial colocalization of Thbs1 with neutrophils (S100a8) and Cd36 with KCs (Clec4f) in sham and I/R liver. (E) UMAP visualization of spatial transcriptomics data identifying cell-type niches in the hepatic microenvironment. (F) Dot plot showing the spatial distribution of Thbs1 and Cd36 in the liver. (G) Spatial visualization of THBS signaling pathway by CellChat analysis.
To further dissect the spatial architecture of hepatic immune microenvironments during I/R injury, we extended our analysis to characterize spatial-specific distribution patterns of major hepatic cell types. Leveraging an established approach (38) to clustering all ST spots based on cell-type composition, we identified 12 distinct cell-type niches (Figure 4E). Integration with scRNA-seq annotations revealed 7 leukocyte-rich niches (1, 2, 4, 6, 7, 10, and 11; composed of macrophages, monocytes, dendritic cells, NK cells, B cells, and other lymphoid populations), 2 myeloid niches (5 and 8), 2 neutrophil-specific niches (9 and 12), and 1 parenchymal niche (3; enriched in hepatocytes and liver sinusoidal endothelial cells). In sham livers, the parenchymal niche was diffusely distributed; however, following I/R, neutrophil-rich niches became spatially restricted to necrotic zones (Figure 4E and Supplemental Figure 12B), indicating the spatial compartmentalization of inflammatory responses. Consistent with transcriptional findings, Thbs1 expression was selectively enriched within neutrophil-dominant niches, whereas Cd36 was preferentially enriched in KC-rich niches (Figure 4F). Notably, ST mapping of I/R liver further revealed that THBS signaling originated from necrotic zones and radiated outward toward adjacent immune-enriched areas (Figure 4G and Supplemental Figure 12C).
Metabolic reprogramming of KCs after I/R associates with CD36-enriched signaling.
We have recently shown that metabolic reprogramming of KCs plays a central role in shaping immune responses during hepatic I/R to exacerbate liver damage (8). Given the enrichment of CD36 expression in I/R–associated KCs and its known role in lipid uptake (39), we next investigated whether liver I/R metabolically reprograms KCs and whether this reprogramming is associated with TSP-1/CD36. Untargeted steady-state metabolomics profiling (40) of sorted KCs revealed a distinct metabolic signature in I/R samples compared with sham controls, as demonstrated by principal component analysis (PCA) (Figure 5A).
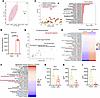 Figure 5
Metabolic reprogramming of KCs after I/R associates with CD36-enriched signaling. (A) Principal component analysis (PCA) of non-targeted metabolomics profiling in I/R-KCs compared with sham-KCs. (B) Normalized hexosylceramide (HexCer) levels in sham and I/R KCs. (C) KEGG enrichment analysis of altered metabolic profiles in I/R-KCs compared with sham-KCs. (D) Scatterplot showing the top enriched functional metabolic pathways in I/R-KCs compared with sham-KCs based on metabolomics data. (E) Heatmap comparing metabolic pathway activity between sham-associated KCs and I/R–associated KCs based on scRNA-seq data. (F) Heatmap comparing metabolic pathway activity in KCs based on human scRNA-seq data from liver transplant patients (GSE171539). (G) Serum alanine aminotransferase (sALT) levels were quantified in I/R mice treated with control or LSKL peptide. (H) Serum IL-6 levels were quantified in I/R mice treated with control or LSKL peptide. (I) Serum myeloperoxidase (MPO) levels were quantified in I/R mice treated with control or LSKL peptide. Data represent the mean ± SEM. *P < 0.05, ****P < 0.0001, by 2-tailed, unpaired t test (B and G–I).
It has been shown that ceramides, as precursors of predominant complex sphingolipids, play a key role in cell stress responses during I/R injury (41). Lipidomic analysis identified marked accumulation of hexosylceramides, including glucosylceramides and galactosylceramides, in I/R–associated KCs (Figure 5B). Given that CD36 promotes the ceramide-to-glucosylceramide conversion pathway (42), this shift strongly implicates CD36 activity in ceramide flux during I/R. Consistently, both KEGG enrichment analysis and overall global pathway analysis highlighted enrichment of sphingolipid metabolism as markedly upregulated and the most enriched metabolic change pathway in I/R-KCs (Figure 5, C and D), suggesting that TSP-1/CD36 signaling contributes to the regulation of sphingolipid homeostasis. To complement metabolomic findings, we performed a complementary metabolic pathway scoring approach (43) using our scRNA-seq data. I/R–associated KCs demonstrated enrichment of glycolysis and CD36-associated lipid metabolic programs, including sphingolipid metabolism, fatty acid degradation, and glycerolipid metabolism. In parallel, pathways related to the tricarboxylic acid (TCA) cycle and OXPHOS were suppressed, consistent with earlier transcriptional analyses (Figure 5E).
To assess the translational relevance of these findings, we used scRNA-seq dataset GSE171539 (37) again to analyze metabolic pathway activity in human KCs during liver transplantation. Consistent with our murine data, PR-KCs exhibited enhanced glycosphingolipid biosynthesis activity, including globo-, lacto-, and neolacto-series pathways (Figure 5F), which is strongly associated with CD36 function and ceramide processing and supports the role of TSP-1/CD36 signaling in driving immune-metabolic reprogramming of KCs across species. Notably, TCA cycle and OXPHOS were found to be suppressed in PR-KCs, consistent with enriched glycolysis in our metabolic analysis of mouse scRNA-seq data. This metabolic profile mirrors that of classically activated macrophages when engaging in potent inflammatory responses (44). Collectively, these results demonstrate that liver I/R is associated with extensive immune-metabolic reprogramming in KCs, including enhanced sphingolipid biosynthesis and suppressed oxidative metabolism. These findings support a model in which CD36-enriched signaling may contribute to the metabolic state of KCs during hepatic I/R injury.
Pharmacologic inhibition of TSP-1 attenuates liver injury after I/R.
Previous studies have implicated TSP-1/CD36 signaling in mediating tissue damage during kidney I/R injury (36). To directly evaluate the role of TSP-1 during hepatic I/R in vivo, we treated I/R–subjected mice with TSP-1 inhibitor (LSKL peptide, sulfosuccinimidyl oleate) (45, 46). Pharmacologic blockade of TSP-1 substantially protected the liver from I/R injury, as evidenced by decreased serum level of alanine aminotransferase activity in comparison with vehicle-treated controls (Figure 5G). In parallel, circulating IL-6 and myeloperoxidase were also markedly decreased in LSKL-treated mice compared with controls, suggesting attenuation of I/R–induced inflammation and neutrophil-associated oxidative stress (Figure 5, H and I). These findings provide in vivo support for the idea that TSP-1 contributes to the severity of liver injury following surgical stress. In the context of our transcriptional, spatial, and metabolomic analyses demonstrating increased neutrophil-derived TSP-1 and elevated CD36 expression in KCs, pharmacologic inhibition of TSP-1 is consistent with disruption of this signaling axis during I/R. While additional studies are required to define cell type–specific mechanisms, these data indicate that TSP-1 signaling represents a promising therapeutic strategy to mitigate the inflammatory consequences of hepatic I/R.


