
Clinical Research and Public HealthGastroenterologyHematologyOncology
Open Access |  10.1172/jci.insight.202662
A lipid-immune network signature defines susceptibility to asparaginase-associated pancreatitis
Cheng-Yu Tsai,1 Na Bo,2 Thai Hoa Tran,3 Maisam Abu-El-Haija,4,5 Gayathri Swaminathan,1 Bomi Lee,1 Sudhir Ghandikota,6 Li Wen,7 Yves Théorêt,8 Steven D. Mittelman,9 Elena J. Ladas,10,11 Anil G. Jegga,4,6 Lewis B. Silverman,10 Ying Ding,12 and Sohail Z. Husain1
1Division of Gastroenterology, Hepatology and Nutrition, Department of Pediatrics, Stanford University, Palo Alto, California, USA.
2Department of Biostatistics, Virginia Commonwealth University, Richmond, Virginia, USA.
3Division of Pediatric Hematology Oncology, Charles-Bruneau Cancer Center, Centre Hospitalier Universitaire Sainte-Justine, Montreal, Quebec, Canada.
4Department of Pediatrics, University of Cincinnati College of Medicine, Cincinnati, Ohio, USA.
5Division of Pediatric Gastroenterology and
6Division of Biomedical Informatics, Cincinnati Children’s Hospital Medical Center, Cincinnati, Ohio, USA.
7Center for Biomarker Discovery and Validation, Peking Union Medical College Hospital, Chinese Academy of Medical Sciences and Peking Union Medical College, Beijing, China.
8Département Clinique de Médecine de Laboratoire, Secteur Pharmacologie Clinique, Optilab Montréal, Centre Hospitalier Universitaire Sainte-Justine, Montreal, Canada.
9Department of Pediatric Endocrinology, University of California, Los Angeles, California, USA.
10Division of Pediatric Hematology, Oncology, and Stem Cell Transplant, Columbia University Irving Medical Center, New York, New York, USA.
11Institute of Human Nutrition, Columbia University, New York, New York, USA.
12Department of Biostatistics and Health Data Science, University of Pittsburgh, Pittsburgh, Pennsylvania, USA.
Address correspondence to: Ying Ding, A713 Public Health, 130 DeSoto Street, Pittsburgh, Pennsylvania, 15261, USA. Email: yingding@pitt.edu. Or to: Sohail Z. Husain, 1701 Page Mill Road, Palo Alto, California, 94304, USA. Email: sohail.husain@stanford.edu.
Authorship note: CYT and NB contributed equally to this work and have been designated as co–first authors.
Find articles by Tsai, C. in: PubMed | Google Scholar
1Division of Gastroenterology, Hepatology and Nutrition, Department of Pediatrics, Stanford University, Palo Alto, California, USA.
2Department of Biostatistics, Virginia Commonwealth University, Richmond, Virginia, USA.
3Division of Pediatric Hematology Oncology, Charles-Bruneau Cancer Center, Centre Hospitalier Universitaire Sainte-Justine, Montreal, Quebec, Canada.
4Department of Pediatrics, University of Cincinnati College of Medicine, Cincinnati, Ohio, USA.
5Division of Pediatric Gastroenterology and
6Division of Biomedical Informatics, Cincinnati Children’s Hospital Medical Center, Cincinnati, Ohio, USA.
7Center for Biomarker Discovery and Validation, Peking Union Medical College Hospital, Chinese Academy of Medical Sciences and Peking Union Medical College, Beijing, China.
8Département Clinique de Médecine de Laboratoire, Secteur Pharmacologie Clinique, Optilab Montréal, Centre Hospitalier Universitaire Sainte-Justine, Montreal, Canada.
9Department of Pediatric Endocrinology, University of California, Los Angeles, California, USA.
10Division of Pediatric Hematology, Oncology, and Stem Cell Transplant, Columbia University Irving Medical Center, New York, New York, USA.
11Institute of Human Nutrition, Columbia University, New York, New York, USA.
12Department of Biostatistics and Health Data Science, University of Pittsburgh, Pittsburgh, Pennsylvania, USA.
Address correspondence to: Ying Ding, A713 Public Health, 130 DeSoto Street, Pittsburgh, Pennsylvania, 15261, USA. Email: yingding@pitt.edu. Or to: Sohail Z. Husain, 1701 Page Mill Road, Palo Alto, California, 94304, USA. Email: sohail.husain@stanford.edu.
Authorship note: CYT and NB contributed equally to this work and have been designated as co–first authors.
Find articles by Bo, N. in: PubMed | Google Scholar
1Division of Gastroenterology, Hepatology and Nutrition, Department of Pediatrics, Stanford University, Palo Alto, California, USA.
2Department of Biostatistics, Virginia Commonwealth University, Richmond, Virginia, USA.
3Division of Pediatric Hematology Oncology, Charles-Bruneau Cancer Center, Centre Hospitalier Universitaire Sainte-Justine, Montreal, Quebec, Canada.
4Department of Pediatrics, University of Cincinnati College of Medicine, Cincinnati, Ohio, USA.
5Division of Pediatric Gastroenterology and
6Division of Biomedical Informatics, Cincinnati Children’s Hospital Medical Center, Cincinnati, Ohio, USA.
7Center for Biomarker Discovery and Validation, Peking Union Medical College Hospital, Chinese Academy of Medical Sciences and Peking Union Medical College, Beijing, China.
8Département Clinique de Médecine de Laboratoire, Secteur Pharmacologie Clinique, Optilab Montréal, Centre Hospitalier Universitaire Sainte-Justine, Montreal, Canada.
9Department of Pediatric Endocrinology, University of California, Los Angeles, California, USA.
10Division of Pediatric Hematology, Oncology, and Stem Cell Transplant, Columbia University Irving Medical Center, New York, New York, USA.
11Institute of Human Nutrition, Columbia University, New York, New York, USA.
12Department of Biostatistics and Health Data Science, University of Pittsburgh, Pittsburgh, Pennsylvania, USA.
Address correspondence to: Ying Ding, A713 Public Health, 130 DeSoto Street, Pittsburgh, Pennsylvania, 15261, USA. Email: yingding@pitt.edu. Or to: Sohail Z. Husain, 1701 Page Mill Road, Palo Alto, California, 94304, USA. Email: sohail.husain@stanford.edu.
Authorship note: CYT and NB contributed equally to this work and have been designated as co–first authors.
Find articles by Tran, T. in: PubMed | Google Scholar
1Division of Gastroenterology, Hepatology and Nutrition, Department of Pediatrics, Stanford University, Palo Alto, California, USA.
2Department of Biostatistics, Virginia Commonwealth University, Richmond, Virginia, USA.
3Division of Pediatric Hematology Oncology, Charles-Bruneau Cancer Center, Centre Hospitalier Universitaire Sainte-Justine, Montreal, Quebec, Canada.
4Department of Pediatrics, University of Cincinnati College of Medicine, Cincinnati, Ohio, USA.
5Division of Pediatric Gastroenterology and
6Division of Biomedical Informatics, Cincinnati Children’s Hospital Medical Center, Cincinnati, Ohio, USA.
7Center for Biomarker Discovery and Validation, Peking Union Medical College Hospital, Chinese Academy of Medical Sciences and Peking Union Medical College, Beijing, China.
8Département Clinique de Médecine de Laboratoire, Secteur Pharmacologie Clinique, Optilab Montréal, Centre Hospitalier Universitaire Sainte-Justine, Montreal, Canada.
9Department of Pediatric Endocrinology, University of California, Los Angeles, California, USA.
10Division of Pediatric Hematology, Oncology, and Stem Cell Transplant, Columbia University Irving Medical Center, New York, New York, USA.
11Institute of Human Nutrition, Columbia University, New York, New York, USA.
12Department of Biostatistics and Health Data Science, University of Pittsburgh, Pittsburgh, Pennsylvania, USA.
Address correspondence to: Ying Ding, A713 Public Health, 130 DeSoto Street, Pittsburgh, Pennsylvania, 15261, USA. Email: yingding@pitt.edu. Or to: Sohail Z. Husain, 1701 Page Mill Road, Palo Alto, California, 94304, USA. Email: sohail.husain@stanford.edu.
Authorship note: CYT and NB contributed equally to this work and have been designated as co–first authors.
Find articles by Abu-El-Haija, M. in: PubMed | Google Scholar
1Division of Gastroenterology, Hepatology and Nutrition, Department of Pediatrics, Stanford University, Palo Alto, California, USA.
2Department of Biostatistics, Virginia Commonwealth University, Richmond, Virginia, USA.
3Division of Pediatric Hematology Oncology, Charles-Bruneau Cancer Center, Centre Hospitalier Universitaire Sainte-Justine, Montreal, Quebec, Canada.
4Department of Pediatrics, University of Cincinnati College of Medicine, Cincinnati, Ohio, USA.
5Division of Pediatric Gastroenterology and
6Division of Biomedical Informatics, Cincinnati Children’s Hospital Medical Center, Cincinnati, Ohio, USA.
7Center for Biomarker Discovery and Validation, Peking Union Medical College Hospital, Chinese Academy of Medical Sciences and Peking Union Medical College, Beijing, China.
8Département Clinique de Médecine de Laboratoire, Secteur Pharmacologie Clinique, Optilab Montréal, Centre Hospitalier Universitaire Sainte-Justine, Montreal, Canada.
9Department of Pediatric Endocrinology, University of California, Los Angeles, California, USA.
10Division of Pediatric Hematology, Oncology, and Stem Cell Transplant, Columbia University Irving Medical Center, New York, New York, USA.
11Institute of Human Nutrition, Columbia University, New York, New York, USA.
12Department of Biostatistics and Health Data Science, University of Pittsburgh, Pittsburgh, Pennsylvania, USA.
Address correspondence to: Ying Ding, A713 Public Health, 130 DeSoto Street, Pittsburgh, Pennsylvania, 15261, USA. Email: yingding@pitt.edu. Or to: Sohail Z. Husain, 1701 Page Mill Road, Palo Alto, California, 94304, USA. Email: sohail.husain@stanford.edu.
Authorship note: CYT and NB contributed equally to this work and have been designated as co–first authors.
Find articles by Swaminathan, G. in: PubMed | Google Scholar
1Division of Gastroenterology, Hepatology and Nutrition, Department of Pediatrics, Stanford University, Palo Alto, California, USA.
2Department of Biostatistics, Virginia Commonwealth University, Richmond, Virginia, USA.
3Division of Pediatric Hematology Oncology, Charles-Bruneau Cancer Center, Centre Hospitalier Universitaire Sainte-Justine, Montreal, Quebec, Canada.
4Department of Pediatrics, University of Cincinnati College of Medicine, Cincinnati, Ohio, USA.
5Division of Pediatric Gastroenterology and
6Division of Biomedical Informatics, Cincinnati Children’s Hospital Medical Center, Cincinnati, Ohio, USA.
7Center for Biomarker Discovery and Validation, Peking Union Medical College Hospital, Chinese Academy of Medical Sciences and Peking Union Medical College, Beijing, China.
8Département Clinique de Médecine de Laboratoire, Secteur Pharmacologie Clinique, Optilab Montréal, Centre Hospitalier Universitaire Sainte-Justine, Montreal, Canada.
9Department of Pediatric Endocrinology, University of California, Los Angeles, California, USA.
10Division of Pediatric Hematology, Oncology, and Stem Cell Transplant, Columbia University Irving Medical Center, New York, New York, USA.
11Institute of Human Nutrition, Columbia University, New York, New York, USA.
12Department of Biostatistics and Health Data Science, University of Pittsburgh, Pittsburgh, Pennsylvania, USA.
Address correspondence to: Ying Ding, A713 Public Health, 130 DeSoto Street, Pittsburgh, Pennsylvania, 15261, USA. Email: yingding@pitt.edu. Or to: Sohail Z. Husain, 1701 Page Mill Road, Palo Alto, California, 94304, USA. Email: sohail.husain@stanford.edu.
Authorship note: CYT and NB contributed equally to this work and have been designated as co–first authors.
Find articles by Lee, B. in: PubMed | Google Scholar
1Division of Gastroenterology, Hepatology and Nutrition, Department of Pediatrics, Stanford University, Palo Alto, California, USA.
2Department of Biostatistics, Virginia Commonwealth University, Richmond, Virginia, USA.
3Division of Pediatric Hematology Oncology, Charles-Bruneau Cancer Center, Centre Hospitalier Universitaire Sainte-Justine, Montreal, Quebec, Canada.
4Department of Pediatrics, University of Cincinnati College of Medicine, Cincinnati, Ohio, USA.
5Division of Pediatric Gastroenterology and
6Division of Biomedical Informatics, Cincinnati Children’s Hospital Medical Center, Cincinnati, Ohio, USA.
7Center for Biomarker Discovery and Validation, Peking Union Medical College Hospital, Chinese Academy of Medical Sciences and Peking Union Medical College, Beijing, China.
8Département Clinique de Médecine de Laboratoire, Secteur Pharmacologie Clinique, Optilab Montréal, Centre Hospitalier Universitaire Sainte-Justine, Montreal, Canada.
9Department of Pediatric Endocrinology, University of California, Los Angeles, California, USA.
10Division of Pediatric Hematology, Oncology, and Stem Cell Transplant, Columbia University Irving Medical Center, New York, New York, USA.
11Institute of Human Nutrition, Columbia University, New York, New York, USA.
12Department of Biostatistics and Health Data Science, University of Pittsburgh, Pittsburgh, Pennsylvania, USA.
Address correspondence to: Ying Ding, A713 Public Health, 130 DeSoto Street, Pittsburgh, Pennsylvania, 15261, USA. Email: yingding@pitt.edu. Or to: Sohail Z. Husain, 1701 Page Mill Road, Palo Alto, California, 94304, USA. Email: sohail.husain@stanford.edu.
Authorship note: CYT and NB contributed equally to this work and have been designated as co–first authors.
Find articles by Ghandikota, S. in: PubMed | Google Scholar
1Division of Gastroenterology, Hepatology and Nutrition, Department of Pediatrics, Stanford University, Palo Alto, California, USA.
2Department of Biostatistics, Virginia Commonwealth University, Richmond, Virginia, USA.
3Division of Pediatric Hematology Oncology, Charles-Bruneau Cancer Center, Centre Hospitalier Universitaire Sainte-Justine, Montreal, Quebec, Canada.
4Department of Pediatrics, University of Cincinnati College of Medicine, Cincinnati, Ohio, USA.
5Division of Pediatric Gastroenterology and
6Division of Biomedical Informatics, Cincinnati Children’s Hospital Medical Center, Cincinnati, Ohio, USA.
7Center for Biomarker Discovery and Validation, Peking Union Medical College Hospital, Chinese Academy of Medical Sciences and Peking Union Medical College, Beijing, China.
8Département Clinique de Médecine de Laboratoire, Secteur Pharmacologie Clinique, Optilab Montréal, Centre Hospitalier Universitaire Sainte-Justine, Montreal, Canada.
9Department of Pediatric Endocrinology, University of California, Los Angeles, California, USA.
10Division of Pediatric Hematology, Oncology, and Stem Cell Transplant, Columbia University Irving Medical Center, New York, New York, USA.
11Institute of Human Nutrition, Columbia University, New York, New York, USA.
12Department of Biostatistics and Health Data Science, University of Pittsburgh, Pittsburgh, Pennsylvania, USA.
Address correspondence to: Ying Ding, A713 Public Health, 130 DeSoto Street, Pittsburgh, Pennsylvania, 15261, USA. Email: yingding@pitt.edu. Or to: Sohail Z. Husain, 1701 Page Mill Road, Palo Alto, California, 94304, USA. Email: sohail.husain@stanford.edu.
Authorship note: CYT and NB contributed equally to this work and have been designated as co–first authors.
Find articles by
Wen, L.
in:
PubMed
|
Google Scholar
|

1Division of Gastroenterology, Hepatology and Nutrition, Department of Pediatrics, Stanford University, Palo Alto, California, USA.
2Department of Biostatistics, Virginia Commonwealth University, Richmond, Virginia, USA.
3Division of Pediatric Hematology Oncology, Charles-Bruneau Cancer Center, Centre Hospitalier Universitaire Sainte-Justine, Montreal, Quebec, Canada.
4Department of Pediatrics, University of Cincinnati College of Medicine, Cincinnati, Ohio, USA.
5Division of Pediatric Gastroenterology and
6Division of Biomedical Informatics, Cincinnati Children’s Hospital Medical Center, Cincinnati, Ohio, USA.
7Center for Biomarker Discovery and Validation, Peking Union Medical College Hospital, Chinese Academy of Medical Sciences and Peking Union Medical College, Beijing, China.
8Département Clinique de Médecine de Laboratoire, Secteur Pharmacologie Clinique, Optilab Montréal, Centre Hospitalier Universitaire Sainte-Justine, Montreal, Canada.
9Department of Pediatric Endocrinology, University of California, Los Angeles, California, USA.
10Division of Pediatric Hematology, Oncology, and Stem Cell Transplant, Columbia University Irving Medical Center, New York, New York, USA.
11Institute of Human Nutrition, Columbia University, New York, New York, USA.
12Department of Biostatistics and Health Data Science, University of Pittsburgh, Pittsburgh, Pennsylvania, USA.
Address correspondence to: Ying Ding, A713 Public Health, 130 DeSoto Street, Pittsburgh, Pennsylvania, 15261, USA. Email: yingding@pitt.edu. Or to: Sohail Z. Husain, 1701 Page Mill Road, Palo Alto, California, 94304, USA. Email: sohail.husain@stanford.edu.
Authorship note: CYT and NB contributed equally to this work and have been designated as co–first authors.
Find articles by Théorêt, Y. in: PubMed | Google Scholar
1Division of Gastroenterology, Hepatology and Nutrition, Department of Pediatrics, Stanford University, Palo Alto, California, USA.
2Department of Biostatistics, Virginia Commonwealth University, Richmond, Virginia, USA.
3Division of Pediatric Hematology Oncology, Charles-Bruneau Cancer Center, Centre Hospitalier Universitaire Sainte-Justine, Montreal, Quebec, Canada.
4Department of Pediatrics, University of Cincinnati College of Medicine, Cincinnati, Ohio, USA.
5Division of Pediatric Gastroenterology and
6Division of Biomedical Informatics, Cincinnati Children’s Hospital Medical Center, Cincinnati, Ohio, USA.
7Center for Biomarker Discovery and Validation, Peking Union Medical College Hospital, Chinese Academy of Medical Sciences and Peking Union Medical College, Beijing, China.
8Département Clinique de Médecine de Laboratoire, Secteur Pharmacologie Clinique, Optilab Montréal, Centre Hospitalier Universitaire Sainte-Justine, Montreal, Canada.
9Department of Pediatric Endocrinology, University of California, Los Angeles, California, USA.
10Division of Pediatric Hematology, Oncology, and Stem Cell Transplant, Columbia University Irving Medical Center, New York, New York, USA.
11Institute of Human Nutrition, Columbia University, New York, New York, USA.
12Department of Biostatistics and Health Data Science, University of Pittsburgh, Pittsburgh, Pennsylvania, USA.
Address correspondence to: Ying Ding, A713 Public Health, 130 DeSoto Street, Pittsburgh, Pennsylvania, 15261, USA. Email: yingding@pitt.edu. Or to: Sohail Z. Husain, 1701 Page Mill Road, Palo Alto, California, 94304, USA. Email: sohail.husain@stanford.edu.
Authorship note: CYT and NB contributed equally to this work and have been designated as co–first authors.
Find articles by
Mittelman, S.
in:
PubMed
|
Google Scholar
|
1Division of Gastroenterology, Hepatology and Nutrition, Department of Pediatrics, Stanford University, Palo Alto, California, USA.
2Department of Biostatistics, Virginia Commonwealth University, Richmond, Virginia, USA.
3Division of Pediatric Hematology Oncology, Charles-Bruneau Cancer Center, Centre Hospitalier Universitaire Sainte-Justine, Montreal, Quebec, Canada.
4Department of Pediatrics, University of Cincinnati College of Medicine, Cincinnati, Ohio, USA.
5Division of Pediatric Gastroenterology and
6Division of Biomedical Informatics, Cincinnati Children’s Hospital Medical Center, Cincinnati, Ohio, USA.
7Center for Biomarker Discovery and Validation, Peking Union Medical College Hospital, Chinese Academy of Medical Sciences and Peking Union Medical College, Beijing, China.
8Département Clinique de Médecine de Laboratoire, Secteur Pharmacologie Clinique, Optilab Montréal, Centre Hospitalier Universitaire Sainte-Justine, Montreal, Canada.
9Department of Pediatric Endocrinology, University of California, Los Angeles, California, USA.
10Division of Pediatric Hematology, Oncology, and Stem Cell Transplant, Columbia University Irving Medical Center, New York, New York, USA.
11Institute of Human Nutrition, Columbia University, New York, New York, USA.
12Department of Biostatistics and Health Data Science, University of Pittsburgh, Pittsburgh, Pennsylvania, USA.
Address correspondence to: Ying Ding, A713 Public Health, 130 DeSoto Street, Pittsburgh, Pennsylvania, 15261, USA. Email: yingding@pitt.edu. Or to: Sohail Z. Husain, 1701 Page Mill Road, Palo Alto, California, 94304, USA. Email: sohail.husain@stanford.edu.
Authorship note: CYT and NB contributed equally to this work and have been designated as co–first authors.
Find articles by Ladas, E. in: PubMed | Google Scholar
1Division of Gastroenterology, Hepatology and Nutrition, Department of Pediatrics, Stanford University, Palo Alto, California, USA.
2Department of Biostatistics, Virginia Commonwealth University, Richmond, Virginia, USA.
3Division of Pediatric Hematology Oncology, Charles-Bruneau Cancer Center, Centre Hospitalier Universitaire Sainte-Justine, Montreal, Quebec, Canada.
4Department of Pediatrics, University of Cincinnati College of Medicine, Cincinnati, Ohio, USA.
5Division of Pediatric Gastroenterology and
6Division of Biomedical Informatics, Cincinnati Children’s Hospital Medical Center, Cincinnati, Ohio, USA.
7Center for Biomarker Discovery and Validation, Peking Union Medical College Hospital, Chinese Academy of Medical Sciences and Peking Union Medical College, Beijing, China.
8Département Clinique de Médecine de Laboratoire, Secteur Pharmacologie Clinique, Optilab Montréal, Centre Hospitalier Universitaire Sainte-Justine, Montreal, Canada.
9Department of Pediatric Endocrinology, University of California, Los Angeles, California, USA.
10Division of Pediatric Hematology, Oncology, and Stem Cell Transplant, Columbia University Irving Medical Center, New York, New York, USA.
11Institute of Human Nutrition, Columbia University, New York, New York, USA.
12Department of Biostatistics and Health Data Science, University of Pittsburgh, Pittsburgh, Pennsylvania, USA.
Address correspondence to: Ying Ding, A713 Public Health, 130 DeSoto Street, Pittsburgh, Pennsylvania, 15261, USA. Email: yingding@pitt.edu. Or to: Sohail Z. Husain, 1701 Page Mill Road, Palo Alto, California, 94304, USA. Email: sohail.husain@stanford.edu.
Authorship note: CYT and NB contributed equally to this work and have been designated as co–first authors.
Find articles by
Jegga, A.
in:
PubMed
|
Google Scholar
|
1Division of Gastroenterology, Hepatology and Nutrition, Department of Pediatrics, Stanford University, Palo Alto, California, USA.
2Department of Biostatistics, Virginia Commonwealth University, Richmond, Virginia, USA.
3Division of Pediatric Hematology Oncology, Charles-Bruneau Cancer Center, Centre Hospitalier Universitaire Sainte-Justine, Montreal, Quebec, Canada.
4Department of Pediatrics, University of Cincinnati College of Medicine, Cincinnati, Ohio, USA.
5Division of Pediatric Gastroenterology and
6Division of Biomedical Informatics, Cincinnati Children’s Hospital Medical Center, Cincinnati, Ohio, USA.
7Center for Biomarker Discovery and Validation, Peking Union Medical College Hospital, Chinese Academy of Medical Sciences and Peking Union Medical College, Beijing, China.
8Département Clinique de Médecine de Laboratoire, Secteur Pharmacologie Clinique, Optilab Montréal, Centre Hospitalier Universitaire Sainte-Justine, Montreal, Canada.
9Department of Pediatric Endocrinology, University of California, Los Angeles, California, USA.
10Division of Pediatric Hematology, Oncology, and Stem Cell Transplant, Columbia University Irving Medical Center, New York, New York, USA.
11Institute of Human Nutrition, Columbia University, New York, New York, USA.
12Department of Biostatistics and Health Data Science, University of Pittsburgh, Pittsburgh, Pennsylvania, USA.
Address correspondence to: Ying Ding, A713 Public Health, 130 DeSoto Street, Pittsburgh, Pennsylvania, 15261, USA. Email: yingding@pitt.edu. Or to: Sohail Z. Husain, 1701 Page Mill Road, Palo Alto, California, 94304, USA. Email: sohail.husain@stanford.edu.
Authorship note: CYT and NB contributed equally to this work and have been designated as co–first authors.
Find articles by Silverman, L. in: PubMed | Google Scholar
1Division of Gastroenterology, Hepatology and Nutrition, Department of Pediatrics, Stanford University, Palo Alto, California, USA.
2Department of Biostatistics, Virginia Commonwealth University, Richmond, Virginia, USA.
3Division of Pediatric Hematology Oncology, Charles-Bruneau Cancer Center, Centre Hospitalier Universitaire Sainte-Justine, Montreal, Quebec, Canada.
4Department of Pediatrics, University of Cincinnati College of Medicine, Cincinnati, Ohio, USA.
5Division of Pediatric Gastroenterology and
6Division of Biomedical Informatics, Cincinnati Children’s Hospital Medical Center, Cincinnati, Ohio, USA.
7Center for Biomarker Discovery and Validation, Peking Union Medical College Hospital, Chinese Academy of Medical Sciences and Peking Union Medical College, Beijing, China.
8Département Clinique de Médecine de Laboratoire, Secteur Pharmacologie Clinique, Optilab Montréal, Centre Hospitalier Universitaire Sainte-Justine, Montreal, Canada.
9Department of Pediatric Endocrinology, University of California, Los Angeles, California, USA.
10Division of Pediatric Hematology, Oncology, and Stem Cell Transplant, Columbia University Irving Medical Center, New York, New York, USA.
11Institute of Human Nutrition, Columbia University, New York, New York, USA.
12Department of Biostatistics and Health Data Science, University of Pittsburgh, Pittsburgh, Pennsylvania, USA.
Address correspondence to: Ying Ding, A713 Public Health, 130 DeSoto Street, Pittsburgh, Pennsylvania, 15261, USA. Email: yingding@pitt.edu. Or to: Sohail Z. Husain, 1701 Page Mill Road, Palo Alto, California, 94304, USA. Email: sohail.husain@stanford.edu.
Authorship note: CYT and NB contributed equally to this work and have been designated as co–first authors.
Find articles by Ding, Y. in: PubMed | Google Scholar
1Division of Gastroenterology, Hepatology and Nutrition, Department of Pediatrics, Stanford University, Palo Alto, California, USA.
2Department of Biostatistics, Virginia Commonwealth University, Richmond, Virginia, USA.
3Division of Pediatric Hematology Oncology, Charles-Bruneau Cancer Center, Centre Hospitalier Universitaire Sainte-Justine, Montreal, Quebec, Canada.
4Department of Pediatrics, University of Cincinnati College of Medicine, Cincinnati, Ohio, USA.
5Division of Pediatric Gastroenterology and
6Division of Biomedical Informatics, Cincinnati Children’s Hospital Medical Center, Cincinnati, Ohio, USA.
7Center for Biomarker Discovery and Validation, Peking Union Medical College Hospital, Chinese Academy of Medical Sciences and Peking Union Medical College, Beijing, China.
8Département Clinique de Médecine de Laboratoire, Secteur Pharmacologie Clinique, Optilab Montréal, Centre Hospitalier Universitaire Sainte-Justine, Montreal, Canada.
9Department of Pediatric Endocrinology, University of California, Los Angeles, California, USA.
10Division of Pediatric Hematology, Oncology, and Stem Cell Transplant, Columbia University Irving Medical Center, New York, New York, USA.
11Institute of Human Nutrition, Columbia University, New York, New York, USA.
12Department of Biostatistics and Health Data Science, University of Pittsburgh, Pittsburgh, Pennsylvania, USA.
Address correspondence to: Ying Ding, A713 Public Health, 130 DeSoto Street, Pittsburgh, Pennsylvania, 15261, USA. Email: yingding@pitt.edu. Or to: Sohail Z. Husain, 1701 Page Mill Road, Palo Alto, California, 94304, USA. Email: sohail.husain@stanford.edu.
Authorship note: CYT and NB contributed equally to this work and have been designated as co–first authors.
Find articles by Husain, S. in: PubMed | Google Scholar
Published May 1, 2026 - More info
JCI Insight. 2026;11(12):e202662. https://doi.org/10.1172/jci.insight.202662.
© 2026 Tsai et al. This work is licensed under the Creative Commons Attribution 4.0 International License. To view a copy of this license, visit http://creativecommons.org/licenses/by/4.0/.
Received: December 22, 2025; Accepted: April 21, 2026


-
Results
Prospective lipidomic profiling identifies postinduction lipid alterations preceding AAP. To identify systemic lipid perturbations that precede the development of AAP, we first performed comprehensive lipidomic profiling in a prospectively sampled discovery cohort of 52 children and adolescents enrolled in DFCI clinical trials (protocols 05-001, ref. 29; 11-001, ref. 30). Plasma samples were collected at 2 time points: an initial sample obtained early during induction therapy prior to any asparaginase exposure (specifically on day 1 for DFCI 05-001 and day 7 for DFCI 11-001), and a postinduction sample collected at the completion of induction after a single asparaginase dose (day 32; Figure 1A). This initial time point preceded asparaginase exposure but did not necessarily precede exposure to other induction agents, including corticosteroids and vincristine (25, 29, 30). Baseline demographic and clinical characteristics of cases and controls have been previous published (31) and are summarized in Tables 1 and 2. Overall characteristics were similar between cases and controls. Primary models were additionally adjusted for prespecified covariates (age, BMI, and ALL risk group; see Methods). Among 52 study participants, 26 developed pancreatitis within 9 months of induction (cases); 26 controls, matched to sex, age, asparaginase formulations, and initial ALL risk, did not. The timing of pancreatitis onset among these cases, including 5 participants who developed pancreatitis during induction therapy (early cases), has been reported (31).
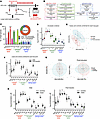 Figure 1
Global lipidomic landscape across induction therapy in the discovery cohort. (A) Study schematic for the discovery cohort, showing prospective plasma sample collection at 2 time points: an initial pre-asparaginase time point and a postinduction time point following exposure to asparaginase-containing induction therapy. (B) Overview of the plasma lipidome measured using the Metabolon Complex Lipid Panel, comprising 3 major lipid groups (neutral lipids, phospholipids, sphingolipids) and 14 lipid classes. (C) Number and proportion of lipid species detected within each lipid class and group after quality filtering. (D) Box-and-whisker plots showing the distribution of lipid class concentrations across all samples, demonstrating expected dominance of cholesteryl esters, triacylglycerols, phosphatidylcholines, and sphingomyelins in human plasma. (E) PCA illustrating a strong separation between initial and postinduction samples when cases and controls are combined, indicating a global lipidomic shift during induction therapy. (F) Comparison of lipid class concentrations between initial and postinduction time points, highlighting increased dispersion and dynamic range postinduction. (G) PCA stratified by case-control status at each time point shows minimal separation at baseline but modest divergence postinduction. (H) Lipid class–level comparisons between cases and controls reveal selective postinduction reductions in lysophosphatidylcholine (LPC), lysophosphatidylethanolamine (LPE), and cholesteryl ester (CE) among cases. *P < 0.05, **P < 0.01; unpaired 2-tailed t test with Welch’s correction. The discovery cohort includes 26 cases and 26 controls. Unless otherwise indicated, analyses include all available samples from these participants at each time point. For all box-and-whisker plots (D, F, and H), center line = median; box = IQR; whiskers = min–max.
Using the Metabolon Complex Lipid Panel, we detected 944 lipid species spanning 3 major lipid groups and 14 lipid classes, with 853 species retained for downstream analysis after quality filtering (Figure 1, B and C, and Supplemental Table 1; supplemental material available online with this article; https://doi.org/10.1172/jci.insight.202662DS1). The overall plasma lipidome composition was consistent with established reference profiles, with neutral lipids predominating, followed by phospholipids and sphingolipids (Figure 1D) (14, 32–34).
The biostatistical analysis methods used to assess the lipidomic profiles between cases and controls at each of the 2 time points are detailed in Supplemental Table 2. Principal component analysis (PCA) revealed clear separation between initial and postinduction samples when cases and controls were combined, indicating a global remodeling of the lipidome during induction therapy (Figure 1E). This shift likely reflects the combined metabolic effects of induction chemotherapy, including corticosteroids and asparaginase, and was accompanied by increased lipid class variability after induction (Figure 1F) (25, 35). At each time point, the cases and controls largely overlapped in PCA (Figure 1G). At the initial time point, lipid class concentrations were comparable (Figure 1H), suggesting similar baseline lipid states prior to asparaginase exposure. By contrast, postinduction comparisons revealed selective lipid class differences between cases and controls (Figure 1H). Notably, LPC, lysophosphatidylethanolamine (LPE), and cholesteryl esters were reduced in cases relative to controls after induction, implicating specific lipid pathways rather than global lipid depletion.
Linear mixed-effects modeling identifies LPC as the dominant lipid class differentiating AAP cases. To rigorously identify lipid species associated with subsequent AAP, we applied linear mixed-effects models incorporating both time points and adjusting for age, BMI, and initial ALL risk (31). At the initial time point, only a single lipid species differed between cases and controls (phosphatidylinositol [PI]) (18:1/18:2); Figure 2A), but this did not remain significant after multiple-testing correction by FDR, and the PI class was not significant in class-level modeling (Supplemental Table 3), reinforcing the absence of baseline differences.
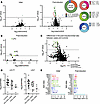 Figure 2
Linear mixed-effects modeling identifies LPC species as key differentiators of AAP cases. (A) Differential lipid species abundance between cases and controls at each time point using linear mixed-effects models adjusted for age, BMI, and initial ALL risk. After induction, 48 lipid species are significantly different, predominantly phospholipids. (B) Lipid class enrichment analysis of the 48 postinduction differential lipid species demonstrates strong overrepresentation of LPC, followed by PC, PE, and LPE. q < 0.05, Fisher’s exact test. (C) Within-subject postinduction to initial ratios reveal that 8 LPC species show significantly attenuated induction-associated increases in cases (n = 24) compared with controls (n = 26). (D) Composite LPC and LPE postinduction/initial ratios stratified by timing of pancreatitis onset show a graded pattern: highest in controls (n = 26), intermediate in non-early cases (n = 19), and lowest in early AAP cases (n = 5). *P < 0.05, **P < 0.01, linear trend test. (E) Multivariable logistic regression demonstrates that higher postinduction (26 controls and 24 cases) LPC and LPE concentrations are independently associated with reduced AAP risk. ORs are shown per 1-unit increase in log2 lipid concentration, adjusted for age, BMI, and initial ALL risk. *95% CI does not cross 1. The discovery cohort includes 26 cases and 26 controls. Unless otherwise indicated, analyses include all available samples from these participants at each time point.
In contrast, postinduction modeling identified 48 lipid species that differed significantly between cases and controls (P < 0.05), with 46 species reduced in cases (Figure 2A and Supplemental Table 4). These species clustered disproportionately within phospholipid classes, particularly LPC (q < 0.0001), followed by phosphatidylcholine (PC), phosphatidylethanolamine (PE), and LPE (Figure 2B). Eight LPC species — LPC(16:0), LPC(16:1), LPC(17:0), LPC(18:0), LPC(18:1), LPC(18:2), LPC(20:3), and LPC(20:4) — accounted for the strongest and most consistent differences.
To distinguish absolute concentration differences from therapy-induced dynamics, we compared within-subject postinduction-to-initial ratios. All 8 LPC species exhibited significantly attenuated post/initial increases in cases relative to controls (Figure 2C and Supplemental Figure 1), indicating a failure to mount a normal LPC response during induction rather than baseline deficiency. Although several individual neutral lipid species (predominantly triacylglycerol [TAG] and diacylglycerol [DAG]) exhibited relatively large absolute log2 fold-change values, these represented a small fraction of the measured species within those classes (e.g., TAG: 11/518, 2.1%; DAG: 2/58, 3.4%) and did not reflect a coordinated class-level shift. Consistent with this pattern, class-level modeling corroborated these findings. Although no lipid class differed at baseline, postinduction LPC and LPE concentrations were significantly lower in cases, and the LPC post/initial ratio remained reduced after covariate adjustment (Supplemental Table 3). Further stratification by pancreatitis timing, using a schema applied in previous omics studies of AAP (31), revealed a graded relationship: controls exhibited the greatest LPC increase, non-early cases showed intermediate responses, and early AAP cases displayed the lowest LPC and LPE ratios (Figure 2D and Supplemental Figure 2). This graded pattern was consistent across the 8 LPC species identified in Figure 2C (Supplemental Figure 3). Interestingly, this graded pattern for LPC and LPE mirrors our prior metabolomic observations in the same cohort (31), in which early AAP cases exhibited the lowest postinduction ratios of vitamin A metabolites, including retinol and carotenoids. Together, these findings suggest that early susceptibility to AAP may reflect broader perturbations in lipid and metabolite homeostasis rather than isolated abnormalities in a single pathway.
Multivariable logistic regression demonstrated that higher postinduction LPC concentrations were associated with a substantially reduced odds of AAP (OR 0.22, 95% CI 0.06–0.58), with LPE showing a weaker association (OR 0.38, 95% CI 0.13–0.91; Figure 2E). In species-level analyses at the postinduction time point (Supplemental Figure 4), LPC(18:0) showed the strongest inverse association with AAP (OR 0.21, 95% CI 0.06–0.58). Multiple additional LPC species also had 95% CIs not crossing 1, indicating that the class-level LPC association is not attributable to a single species. Across analytic approaches, LPC emerged as the most robust lipid class associated with AAP susceptibility.
Network analysis reveals disruption of LPC coregulation preceding and following induction. To determine whether AAP was associated not only with altered lipid abundance but also with disrupted lipid coordination, we applied weighted gene coexpression network analysis (WGCNA) in a data-driven manner (36, 37). At the initial time point, lipid species clustered into 11 modules based on correlated abundance patterns in controls (Supplemental Figure 5A). Module preservation analysis identified 3 modules that were not preserved in cases, indicating altered correlation structure prior to asparaginase exposure (Supplemental Figure 5B and Supplemental Table 5). Strikingly, 11 of 12 detected LPC species localized to a single nonpreserved module (M11, Supplemental Figure 5), including all 8 LPC species identified in the differential abundance analysis (Figure 2C and Supplemental Table 4). These findings indicate that LPC dysregulation in AAP is detectable at the network level even before treatment-induced lipid shifts occur. Postinduction WGCNA revealed further divergence. We also performed postinduction module preservation analysis in the discovery cohort, and the evaluable modules were preserved. Because uncorrelated lipid species are excluded from preservation calculations, we additionally examined changes in the uncorrelated lipid species set. The proportion of uncorrelated lipid species increased markedly in cases, particularly among phospholipids and sphingolipids (Supplemental Figure 6 and Supplemental Table 6). Notably, 11 of 12 LPC species were classified as uncorrelated in cases after induction, consistent with widespread disruption of LPC coregulation during therapy. The absence of module membership among these lipids (i.e., uncorrelated lipid species) indicates loss of coordinated regulation rather than stochastic variation, consistent with biologically meaningful disruption of LPC-centered metabolic networks during induction therapy (36).
Independent validation cohort recapitulates LPC-centered network disruption. To validate these findings, we analyzed an independent cohort of 109 pediatric ALL patients enrolled in DFCI 16-001 (53 AAP cases, 56 controls) (31). Baseline demographic and clinical characteristics of cases and controls are summarized in Tables 3 and 4. Lipidomic coverage and class distributions closely mirrored those of the discovery cohort, with greater than 90% overlap in detected species (Figure 3, A–C, and Supplemental Table 7). Unlike the discovery cohort, global PCA separation between cases and controls showed substantial overlap (Figure 3D), and we did not detect statistically significant case-control differences using linear mixed-effects or multivariable models. This could reflect differences between the validation and discovery cohorts, including nonfasting collection influenced by regional diet, serum versus plasma matrix effects, and clinical trial protocol differences, which can increase variability and obscure mean shifts that these models are designed to detect. We therefore next applied network-based analysis. At the initial time point, WGCNA categorized 10 of 16 LPCs (62.5%) in controls as uncorrelated lipid species. Consistent with this, 35.3% of phospholipids (including LPCs) and 63.7% of sphingolipids were uncorrelated and therefore excluded from preservation testing, making module preservation analysis less informative at this time point; the evaluable modules were preserved. In contrast, postinduction WGCNA identified a nonpreserved module (M2) enriched for LPC species when controls were used as the reference (Figure 3, E–F, and Supplemental Table 8). The 8 LPC species previously identified in the discovery cohort localized to nonpreserved or weakly preserved modules (M2 and M6) in the validation cohort, confirming reproducible LPC-centered network disruption across independent populations. Together, these cross-cohort analyses support LPC dysregulation as a consistent feature of AAP susceptibility.
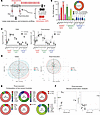 Figure 3
LPC-centered lipidomic signatures replicate in an independent validation cohort. (A) Study schematic for the independent validation cohort, showing identical longitudinal sampling design. (B) Distribution of lipid species across lipid classes mirrors that of the discovery cohort, with more than 90% overlap in detected species. (C) Lipid class concentrations across time points demonstrate similar induction-associated shifts as observed in the discovery cohort. Box-and-whisker plots show median (center line), IQR (box), and range (whiskers: min–max). (D) PCA stratified by case-control status shows limited global separation, emphasizing the need for network-level analyses. (E) WGCNA modules identified in postinduction samples from controls, ranked by module size. (F) Module preservation analysis identifies a nonpreserved module enriched for LPC species in cases, indicating disrupted LPC coregulation after induction therapy. Validation cohort includes 56 cases and 53 controls. Unless otherwise indicated, analyses include all available samples from these participants at each time point.
Proteomic profiling reveals cytokine pathway enrichment. To investigate whether lipid alterations were accompanied by coordinated changes in circulating proteins, we performed serum proteomic profiling in the validation cohort using the Olink Explore 3072 platform. Proteomic profiling was restricted to the validation cohort because insufficient plasma from the discovery cohort was available for proteomics. Of 2,943 proteins assayed, 2,538 passed quality filters and were included in downstream analyses for each time point (Supplemental Figure 7 and Supplemental Table 9).
Within-subject post/initial comparisons identified 103 differentially expressed proteins between cases and controls (Figure 4A). Pathway enrichment analysis revealed that all 10 significantly enriched pathways were cytokine-related (Figure 4B and Supplemental Table 10), including IL-6 signaling and other inflammatory cascades previously implicated in acute pancreatitis (38, 39).
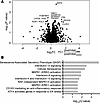 Figure 4
Proteomic profiling reveals cytokine pathway enrichment associated with AAP. (A) Volcano plot showing differentially expressed proteins based on within-subject postinduction-to-initial ratios between cases and controls. Only proteins with a P value less than 0.01 were annotated. (B) Pathway enrichment analysis demonstrates that all top enriched pathways are cytokine-related, including pathways previously implicated in pancreatitis-associated inflammation. q < 0.05, Fisher’s exact test. Validation cohort proteomics: controls, n = 48; cases, n = 52.
Given the convergence of lipid and cytokine signals, we examined postinduction associations for each of the 8 significant LPC species and 109 cytokines (Supplemental Table 11). The complete LPC-cytokine association matrix is shown in Supplemental Figure 8. Among the 8 LPC species, LPC(18:0) showed the greatest case-control divergence: in controls, LPC(18:0) was positively associated with 23 cytokines, whereas in cases it showed fewer positive and more negative associations (Figure 5A).
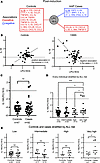 Figure 5
Integrated lipidomic-proteomic analysis identifies an IL-18/LPC signature in VHR ALL. (A) Network visualization of LPC(18:0)-cytokine associations show predominantly positive associations in controls and a mixed pattern in cases, with IL-18 switching from a positive association in controls to a negative association in cases. (B) Pearson’s correlation analysis confirms a positive IL-18–LPC(18:0) relationship in controls and an inverse relationship in cases. Both axes are presented on a log2 scale. (C) IL-18/LPC(18:0) ratios do not differ globally between cases and controls but reveal a subset of cases with markedly elevated ratios. Unpaired 2-tailed t test with Welch’s correction. (D) Stratification by ALL risk demonstrates significantly higher IL-18/LPC(18:0) ratios in participants with VHR ALL. *P < 0.05, ***P < 0.001; 1-way ANOVA. (E) Within the VHR subgroup, cases show significantly elevated IL-18/LPC(18:0) ratios compared with controls. *P < 0.05; unpaired 2-tailed t test with Welch’s correction.
IL-18/LPC ratios reveal a context-dependent AAP susceptibility signal in VHR ALL. Notably, the association between LPC(18:0) and IL-18 switched direction, from positive in controls to negative in cases (Figure 5, A and B). Although absolute IL-18/LPC(18:0) ratios did not differ globally between cases and controls (Figure 5C), stratification by ALL risk revealed that this ratio was selectively elevated among participants with VHR ALL (Figure 5D). In DFCI 16-001, VHR ALL is protocol-defined by adverse leukemia biology (including IKZF1 deletion) and/or by persistently elevated minimal residual disease at the end of Induction 1B, assessed approximately 10 weeks after starting therapy (40). Together, these observations suggest that the IL-18/LPC imbalance is most apparent within a biologically high-risk leukemia context.
When cases and controls were examined within each DFCI 16-001 risk stratum, the IL-18/LPC(18:0) ratio was significantly elevated in cases compared with controls specifically within the VHR subgroup, but not within the low-, intermediate-, or high-risk groups (Figure 5E). Consistent with this risk-restricted pattern, receiver operating characteristic (ROC) analysis limited to the VHR subgroup showed discrimination of AAP cases from controls (AUC = 0.81; P < 0.05) (Supplemental Figure 9).
A parallel pattern was observed for IL-18/LPC(20:4), which was identified in the same panel-wide analysis of all 8 LPC species and exhibited similar case-control divergence within the VHR subgroup (Supplemental Figure 10), supporting the robustness of an IL-18/LPC axis rather than dependence on a single lipid species. Collectively, these findings indicate that IL-18/LPC ratios provide context-dependent discriminatory information, particularly within the VHR ALL population. Clinical characteristics of the VHR subgroup are summarized in Supplemental Table 12.
To explore whether this VHR-restricted IL-18/LPC signal aligns with underlying leukemia biology, we examined available leukemic-cell transcriptomic data. RNA-Seq data were available for 10 of 16 VHR participants (3 controls and 7 cases) (40). Among the 7 VHR cases who developed AAP, 4 exhibited Philadelphia chromosome–like (Ph-like) ALL, characterized by kinase-activating lesions involving the JAK/STAT pathway (ZBTB44:JAK2, GOLGB1:JAK2, IL7R L243>PSCS, SH2B3 F146fs) or ABL-class fusions (ETV6:ABL1), whereas none of the controls demonstrated Ph-like features. In addition, 4 of 7 VHR cases harbored RAS/MAPK pathway mutations (KRAS G12D, KRAS A59E, KRAS A59G, FLT3 N676S), which were absent in the controls.
Although these transcriptomic observations are descriptive and limited by sample size, they suggest that the IL-18/LPC imbalance associated with AAP may preferentially arise in leukemias marked by kinase-driven signaling programs and heightened inflammatory or metabolic stress. Further studies will be required to determine whether IL-18/LPC profiles associated with AAP are consistently enriched within specific ALL molecular subtypes, particularly those with kinase-activating alterations such as Ph-like ALL.


