
Research ArticleHematologyOncology
Open Access |  10.1172/jci.insight.199771
Latexin deletion in the bone marrow niche suppresses leukemia via LIFR downregulation and immune activation
Cuiping Zhang,1 Xia Yao,2 Pinpin Sui,3 Liming Hou,1 Bowen Yan,4 Larry L. Luchsinger,1 Gang Huang,3 Sheng Tong,5 Youwen Zhang,6 Bojing Shao,1 Hong Qian,7 Hong Zheng,8 Hui Zhong,1 Feng-Chun Yang,3 and Ying Liang1
1Department of Toxicology and Cancer Biology, University of Kentucky, Lexington, Kentucky, USA.
2Lindsley F. Kimball Research Institute, New York Blood Center, Rye, New York, USA.
3Department of Cell Systems & Anatomy, University of Texas Health at San Antonio, San Antonio, Texas, USA.
4Department of Pharmacodynamics, College of Pharmacy, University of Florida, Gainesville, Florida, USA.
5Department of Bioengineering, University of Kentucky, Lexington, Kentucky, USA.
6Center for Computational and Integrative Biology, Rutgers University-Camden, Camden, New Jersey, USA.
7Karolinska Institute, Flemingsberg Campus, Huddinge, Sweden.
8Division of Hematology/Oncology, Penn State University College of Medicine, Hershey, Pennsylvania, USA.
Address correspondence to: Ying Liang, Lindsley F. Kimball Research Institute, New York Blood Center, 601 Midland Ave., Rye, New York, 10580, USA. Phone: 212.570.3015; Email: yliang@nybc.org.
Authorship note: CZ, XY, and PS have been designated as co–first authors.
Find articles by Zhang, C. in: PubMed | Google Scholar
1Department of Toxicology and Cancer Biology, University of Kentucky, Lexington, Kentucky, USA.
2Lindsley F. Kimball Research Institute, New York Blood Center, Rye, New York, USA.
3Department of Cell Systems & Anatomy, University of Texas Health at San Antonio, San Antonio, Texas, USA.
4Department of Pharmacodynamics, College of Pharmacy, University of Florida, Gainesville, Florida, USA.
5Department of Bioengineering, University of Kentucky, Lexington, Kentucky, USA.
6Center for Computational and Integrative Biology, Rutgers University-Camden, Camden, New Jersey, USA.
7Karolinska Institute, Flemingsberg Campus, Huddinge, Sweden.
8Division of Hematology/Oncology, Penn State University College of Medicine, Hershey, Pennsylvania, USA.
Address correspondence to: Ying Liang, Lindsley F. Kimball Research Institute, New York Blood Center, 601 Midland Ave., Rye, New York, 10580, USA. Phone: 212.570.3015; Email: yliang@nybc.org.
Authorship note: CZ, XY, and PS have been designated as co–first authors.
Find articles by Yao, X. in: PubMed | Google Scholar
1Department of Toxicology and Cancer Biology, University of Kentucky, Lexington, Kentucky, USA.
2Lindsley F. Kimball Research Institute, New York Blood Center, Rye, New York, USA.
3Department of Cell Systems & Anatomy, University of Texas Health at San Antonio, San Antonio, Texas, USA.
4Department of Pharmacodynamics, College of Pharmacy, University of Florida, Gainesville, Florida, USA.
5Department of Bioengineering, University of Kentucky, Lexington, Kentucky, USA.
6Center for Computational and Integrative Biology, Rutgers University-Camden, Camden, New Jersey, USA.
7Karolinska Institute, Flemingsberg Campus, Huddinge, Sweden.
8Division of Hematology/Oncology, Penn State University College of Medicine, Hershey, Pennsylvania, USA.
Address correspondence to: Ying Liang, Lindsley F. Kimball Research Institute, New York Blood Center, 601 Midland Ave., Rye, New York, 10580, USA. Phone: 212.570.3015; Email: yliang@nybc.org.
Authorship note: CZ, XY, and PS have been designated as co–first authors.
Find articles by
Sui, P.
in:
PubMed
|
Google Scholar
|

1Department of Toxicology and Cancer Biology, University of Kentucky, Lexington, Kentucky, USA.
2Lindsley F. Kimball Research Institute, New York Blood Center, Rye, New York, USA.
3Department of Cell Systems & Anatomy, University of Texas Health at San Antonio, San Antonio, Texas, USA.
4Department of Pharmacodynamics, College of Pharmacy, University of Florida, Gainesville, Florida, USA.
5Department of Bioengineering, University of Kentucky, Lexington, Kentucky, USA.
6Center for Computational and Integrative Biology, Rutgers University-Camden, Camden, New Jersey, USA.
7Karolinska Institute, Flemingsberg Campus, Huddinge, Sweden.
8Division of Hematology/Oncology, Penn State University College of Medicine, Hershey, Pennsylvania, USA.
Address correspondence to: Ying Liang, Lindsley F. Kimball Research Institute, New York Blood Center, 601 Midland Ave., Rye, New York, 10580, USA. Phone: 212.570.3015; Email: yliang@nybc.org.
Authorship note: CZ, XY, and PS have been designated as co–first authors.
Find articles by Hou, L. in: PubMed | Google Scholar
1Department of Toxicology and Cancer Biology, University of Kentucky, Lexington, Kentucky, USA.
2Lindsley F. Kimball Research Institute, New York Blood Center, Rye, New York, USA.
3Department of Cell Systems & Anatomy, University of Texas Health at San Antonio, San Antonio, Texas, USA.
4Department of Pharmacodynamics, College of Pharmacy, University of Florida, Gainesville, Florida, USA.
5Department of Bioengineering, University of Kentucky, Lexington, Kentucky, USA.
6Center for Computational and Integrative Biology, Rutgers University-Camden, Camden, New Jersey, USA.
7Karolinska Institute, Flemingsberg Campus, Huddinge, Sweden.
8Division of Hematology/Oncology, Penn State University College of Medicine, Hershey, Pennsylvania, USA.
Address correspondence to: Ying Liang, Lindsley F. Kimball Research Institute, New York Blood Center, 601 Midland Ave., Rye, New York, 10580, USA. Phone: 212.570.3015; Email: yliang@nybc.org.
Authorship note: CZ, XY, and PS have been designated as co–first authors.
Find articles by Yan, B. in: PubMed | Google Scholar
1Department of Toxicology and Cancer Biology, University of Kentucky, Lexington, Kentucky, USA.
2Lindsley F. Kimball Research Institute, New York Blood Center, Rye, New York, USA.
3Department of Cell Systems & Anatomy, University of Texas Health at San Antonio, San Antonio, Texas, USA.
4Department of Pharmacodynamics, College of Pharmacy, University of Florida, Gainesville, Florida, USA.
5Department of Bioengineering, University of Kentucky, Lexington, Kentucky, USA.
6Center for Computational and Integrative Biology, Rutgers University-Camden, Camden, New Jersey, USA.
7Karolinska Institute, Flemingsberg Campus, Huddinge, Sweden.
8Division of Hematology/Oncology, Penn State University College of Medicine, Hershey, Pennsylvania, USA.
Address correspondence to: Ying Liang, Lindsley F. Kimball Research Institute, New York Blood Center, 601 Midland Ave., Rye, New York, 10580, USA. Phone: 212.570.3015; Email: yliang@nybc.org.
Authorship note: CZ, XY, and PS have been designated as co–first authors.
Find articles by Luchsinger, L. in: PubMed | Google Scholar
1Department of Toxicology and Cancer Biology, University of Kentucky, Lexington, Kentucky, USA.
2Lindsley F. Kimball Research Institute, New York Blood Center, Rye, New York, USA.
3Department of Cell Systems & Anatomy, University of Texas Health at San Antonio, San Antonio, Texas, USA.
4Department of Pharmacodynamics, College of Pharmacy, University of Florida, Gainesville, Florida, USA.
5Department of Bioengineering, University of Kentucky, Lexington, Kentucky, USA.
6Center for Computational and Integrative Biology, Rutgers University-Camden, Camden, New Jersey, USA.
7Karolinska Institute, Flemingsberg Campus, Huddinge, Sweden.
8Division of Hematology/Oncology, Penn State University College of Medicine, Hershey, Pennsylvania, USA.
Address correspondence to: Ying Liang, Lindsley F. Kimball Research Institute, New York Blood Center, 601 Midland Ave., Rye, New York, 10580, USA. Phone: 212.570.3015; Email: yliang@nybc.org.
Authorship note: CZ, XY, and PS have been designated as co–first authors.
Find articles by Huang, G. in: PubMed | Google Scholar
1Department of Toxicology and Cancer Biology, University of Kentucky, Lexington, Kentucky, USA.
2Lindsley F. Kimball Research Institute, New York Blood Center, Rye, New York, USA.
3Department of Cell Systems & Anatomy, University of Texas Health at San Antonio, San Antonio, Texas, USA.
4Department of Pharmacodynamics, College of Pharmacy, University of Florida, Gainesville, Florida, USA.
5Department of Bioengineering, University of Kentucky, Lexington, Kentucky, USA.
6Center for Computational and Integrative Biology, Rutgers University-Camden, Camden, New Jersey, USA.
7Karolinska Institute, Flemingsberg Campus, Huddinge, Sweden.
8Division of Hematology/Oncology, Penn State University College of Medicine, Hershey, Pennsylvania, USA.
Address correspondence to: Ying Liang, Lindsley F. Kimball Research Institute, New York Blood Center, 601 Midland Ave., Rye, New York, 10580, USA. Phone: 212.570.3015; Email: yliang@nybc.org.
Authorship note: CZ, XY, and PS have been designated as co–first authors.
Find articles by Tong, S. in: PubMed | Google Scholar
1Department of Toxicology and Cancer Biology, University of Kentucky, Lexington, Kentucky, USA.
2Lindsley F. Kimball Research Institute, New York Blood Center, Rye, New York, USA.
3Department of Cell Systems & Anatomy, University of Texas Health at San Antonio, San Antonio, Texas, USA.
4Department of Pharmacodynamics, College of Pharmacy, University of Florida, Gainesville, Florida, USA.
5Department of Bioengineering, University of Kentucky, Lexington, Kentucky, USA.
6Center for Computational and Integrative Biology, Rutgers University-Camden, Camden, New Jersey, USA.
7Karolinska Institute, Flemingsberg Campus, Huddinge, Sweden.
8Division of Hematology/Oncology, Penn State University College of Medicine, Hershey, Pennsylvania, USA.
Address correspondence to: Ying Liang, Lindsley F. Kimball Research Institute, New York Blood Center, 601 Midland Ave., Rye, New York, 10580, USA. Phone: 212.570.3015; Email: yliang@nybc.org.
Authorship note: CZ, XY, and PS have been designated as co–first authors.
Find articles by Zhang, Y. in: PubMed | Google Scholar
1Department of Toxicology and Cancer Biology, University of Kentucky, Lexington, Kentucky, USA.
2Lindsley F. Kimball Research Institute, New York Blood Center, Rye, New York, USA.
3Department of Cell Systems & Anatomy, University of Texas Health at San Antonio, San Antonio, Texas, USA.
4Department of Pharmacodynamics, College of Pharmacy, University of Florida, Gainesville, Florida, USA.
5Department of Bioengineering, University of Kentucky, Lexington, Kentucky, USA.
6Center for Computational and Integrative Biology, Rutgers University-Camden, Camden, New Jersey, USA.
7Karolinska Institute, Flemingsberg Campus, Huddinge, Sweden.
8Division of Hematology/Oncology, Penn State University College of Medicine, Hershey, Pennsylvania, USA.
Address correspondence to: Ying Liang, Lindsley F. Kimball Research Institute, New York Blood Center, 601 Midland Ave., Rye, New York, 10580, USA. Phone: 212.570.3015; Email: yliang@nybc.org.
Authorship note: CZ, XY, and PS have been designated as co–first authors.
Find articles by Shao, B. in: PubMed | Google Scholar
1Department of Toxicology and Cancer Biology, University of Kentucky, Lexington, Kentucky, USA.
2Lindsley F. Kimball Research Institute, New York Blood Center, Rye, New York, USA.
3Department of Cell Systems & Anatomy, University of Texas Health at San Antonio, San Antonio, Texas, USA.
4Department of Pharmacodynamics, College of Pharmacy, University of Florida, Gainesville, Florida, USA.
5Department of Bioengineering, University of Kentucky, Lexington, Kentucky, USA.
6Center for Computational and Integrative Biology, Rutgers University-Camden, Camden, New Jersey, USA.
7Karolinska Institute, Flemingsberg Campus, Huddinge, Sweden.
8Division of Hematology/Oncology, Penn State University College of Medicine, Hershey, Pennsylvania, USA.
Address correspondence to: Ying Liang, Lindsley F. Kimball Research Institute, New York Blood Center, 601 Midland Ave., Rye, New York, 10580, USA. Phone: 212.570.3015; Email: yliang@nybc.org.
Authorship note: CZ, XY, and PS have been designated as co–first authors.
Find articles by
Qian, H.
in:
PubMed
|
Google Scholar
|
1Department of Toxicology and Cancer Biology, University of Kentucky, Lexington, Kentucky, USA.
2Lindsley F. Kimball Research Institute, New York Blood Center, Rye, New York, USA.
3Department of Cell Systems & Anatomy, University of Texas Health at San Antonio, San Antonio, Texas, USA.
4Department of Pharmacodynamics, College of Pharmacy, University of Florida, Gainesville, Florida, USA.
5Department of Bioengineering, University of Kentucky, Lexington, Kentucky, USA.
6Center for Computational and Integrative Biology, Rutgers University-Camden, Camden, New Jersey, USA.
7Karolinska Institute, Flemingsberg Campus, Huddinge, Sweden.
8Division of Hematology/Oncology, Penn State University College of Medicine, Hershey, Pennsylvania, USA.
Address correspondence to: Ying Liang, Lindsley F. Kimball Research Institute, New York Blood Center, 601 Midland Ave., Rye, New York, 10580, USA. Phone: 212.570.3015; Email: yliang@nybc.org.
Authorship note: CZ, XY, and PS have been designated as co–first authors.
Find articles by Zheng, H. in: PubMed | Google Scholar
1Department of Toxicology and Cancer Biology, University of Kentucky, Lexington, Kentucky, USA.
2Lindsley F. Kimball Research Institute, New York Blood Center, Rye, New York, USA.
3Department of Cell Systems & Anatomy, University of Texas Health at San Antonio, San Antonio, Texas, USA.
4Department of Pharmacodynamics, College of Pharmacy, University of Florida, Gainesville, Florida, USA.
5Department of Bioengineering, University of Kentucky, Lexington, Kentucky, USA.
6Center for Computational and Integrative Biology, Rutgers University-Camden, Camden, New Jersey, USA.
7Karolinska Institute, Flemingsberg Campus, Huddinge, Sweden.
8Division of Hematology/Oncology, Penn State University College of Medicine, Hershey, Pennsylvania, USA.
Address correspondence to: Ying Liang, Lindsley F. Kimball Research Institute, New York Blood Center, 601 Midland Ave., Rye, New York, 10580, USA. Phone: 212.570.3015; Email: yliang@nybc.org.
Authorship note: CZ, XY, and PS have been designated as co–first authors.
Find articles by Zhong, H. in: PubMed | Google Scholar
1Department of Toxicology and Cancer Biology, University of Kentucky, Lexington, Kentucky, USA.
2Lindsley F. Kimball Research Institute, New York Blood Center, Rye, New York, USA.
3Department of Cell Systems & Anatomy, University of Texas Health at San Antonio, San Antonio, Texas, USA.
4Department of Pharmacodynamics, College of Pharmacy, University of Florida, Gainesville, Florida, USA.
5Department of Bioengineering, University of Kentucky, Lexington, Kentucky, USA.
6Center for Computational and Integrative Biology, Rutgers University-Camden, Camden, New Jersey, USA.
7Karolinska Institute, Flemingsberg Campus, Huddinge, Sweden.
8Division of Hematology/Oncology, Penn State University College of Medicine, Hershey, Pennsylvania, USA.
Address correspondence to: Ying Liang, Lindsley F. Kimball Research Institute, New York Blood Center, 601 Midland Ave., Rye, New York, 10580, USA. Phone: 212.570.3015; Email: yliang@nybc.org.
Authorship note: CZ, XY, and PS have been designated as co–first authors.
Find articles by Yang, F. in: PubMed | Google Scholar
1Department of Toxicology and Cancer Biology, University of Kentucky, Lexington, Kentucky, USA.
2Lindsley F. Kimball Research Institute, New York Blood Center, Rye, New York, USA.
3Department of Cell Systems & Anatomy, University of Texas Health at San Antonio, San Antonio, Texas, USA.
4Department of Pharmacodynamics, College of Pharmacy, University of Florida, Gainesville, Florida, USA.
5Department of Bioengineering, University of Kentucky, Lexington, Kentucky, USA.
6Center for Computational and Integrative Biology, Rutgers University-Camden, Camden, New Jersey, USA.
7Karolinska Institute, Flemingsberg Campus, Huddinge, Sweden.
8Division of Hematology/Oncology, Penn State University College of Medicine, Hershey, Pennsylvania, USA.
Address correspondence to: Ying Liang, Lindsley F. Kimball Research Institute, New York Blood Center, 601 Midland Ave., Rye, New York, 10580, USA. Phone: 212.570.3015; Email: yliang@nybc.org.
Authorship note: CZ, XY, and PS have been designated as co–first authors.
Find articles by Liang, Y. in: PubMed | Google Scholar
Published October 8, 2026 - More info
JCI Insight. 2026;11(19):e199771. https://doi.org/10.1172/jci.insight.199771.
© 2026 Zhang et al. This work is licensed under the Creative Commons Attribution 4.0 International License. To view a copy of this license, visit http://creativecommons.org/licenses/by/4.0/.
Received: September 5, 2025; Accepted: August 17, 2026


-
Results
Lxn deletion alters cellular composition in BM niche. The function of Lxn in regulating BM niche is unknown. We characterized the main niche cell populations, including mesenchymal stromal cell (MSC, CD45–Ter119–CD31–Sca1+CD51+), osteoblast (OB, CD45–Ter119–CD31–Sca1–CD51+), and endothelia cell (EC, CD45–Ter119–CD31+Sca1+) by flow cytometry in WT and Lxn–/– mice (Figure 1A) (14, 42, 43). The percentages and absolute numbers of MSCs and OBs significantly increased in the Lxn–/– niche compared with WT mice (Figure 1, B and C), whereas EC population didn’t show significant differences (data not shown). The increased number of MSCs was further confirmed by CFU-F assay (Figure 1D). MSCs are important to maintain normal HSC function (44, 45). We previously reported that Lxn–/– HSCs had increased capacity of self-renewal and regeneration (38). To further determine whether Lxn regulates HSC and hematopoiesis in a cell-extrinsic manner, we generated MSC-specific Lxn-KO mouse model by crossing Lxnloxp/loxp line (Supplemental Figure 1A; supplemental material available online with this article; https://doi.org/10.1172/jci.insight.199771DS1) with the Nes-Cre line (Nes-Cre: Lxnloxp/loxp) and analyzed the peripheral blood (PB) lineage differentiation and BM HSPC populations by flow cytometry and colony assay (38). Surprisingly, we didn’t see any significant changes in WBC numbers, lymphoid or myeloid differentiation (Supplemental Figure 1, B and C), BM cellularity, or numbers of HSPC subpopulations (Supplemental Figure 1, D–G). We also analyzed the MSC in Nes-Cre: Lxnloxp/loxp mice and found a significant increase in both frequency and absolute numbers of immunophenotypic MSCs (Figure 1E). We made the OB-specific Lxn–/– mouse lines (Osx-Cre: Lxnloxp/loxp) and performed the same hematopoietic and stromal analyses. We didn’t see any significant differences in hematopoiesis or OBs in Osx-Cre: Lxnloxp/loxp line (Supplemental Figure 2). These results suggest that Lxn deletion altered niche cellular composition but has no functional effects on hemostatic hematopoiesis.
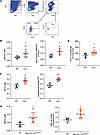 Figure 1
Lxn deletion alters BM niche cellular composition under steady-state conditions. (A) Representative flow cytometry profiles of MSCs, OBs, and endothelial cells (ECs). (B) Percentages (left panel) and absolute numbers (right panel) of MSCs in the Lxn–/– mice compared with the WT mice. (C) Percentages (left panel) and absolute numbers (right panel) of OBs in the Lxn–/– mice compared with the WT mice. (D) CFU-F numbers in the Lxn–/– mice compared with the WT mice. (E) Percentages (left panel) and absolute numbers (right panel) of MSCs in the Nes-Cre: Lxnloxp/loxp conditional KO mice compared with the WT litter-mate control mice. Data are shown as mean ± SD for the indicated number of mice from a single experiment. A 2-tailed, unpaired Student’s t test was performed. *P < 0.05, **P < 0.01, ****P < 0.0001.
Lxn deletion in BM niche enhances AML mice survival and suppresses leukemic cells. The expansion of normal MSCs and OBs has been shown to inhibit leukemia development (7, 14). We then asked whether a Lxn-depleted niche could affect leukemia development. We established a MLL-AF9–induced (MA9-induced) AML model in Lxn–/– and WT mice. Lineage depleted WT BM cells (Lin–) were transduced with MA9-GFP retrovirus and transplanted into lethally irradiated Lxn–/– or WT control mice (Figure 2A). We found that Lxn–/– recipient mice had a significant survival advantage over WT recipient mice; the median survival time was 61 days in Lxn–/– recipients versus 35 days in WT recipients (Figure 2B). Consistently, the percentage of leukemic blasts (GFP+) in the PB (Figure 2C) and the absolute numbers of LSCs (GFP+Lin–ckit+CD34dimCD16/CD32+, leukemia granulocyte–macrophage progenitor (L-GMP) in both PB and BM (Supplemental Figure 3, A and B) were significantly decreased in Lxn–/– recipient mice at 42 days after transplant (Figure 2, D and E, respectively). To determine whether the survival advantage observed in Lxn–/– recipients resulted from impaired leukemia propagation or from microenvironmental effects during disease development, we performed secondary transplantation. AML cells isolated from primary WT and Lxn–/– recipient mice were transplanted into secondary WT and Lxn–/– recipients. No significant differences in leukemic burden were observed among the 4 groups (Supplemental Figure 3C). These findings suggest that Lxn deficiency within the recipient microenvironment does not durably alter the leukemia-propagating capacity of AML cells. Rather, the protective effect of Lxn deletion appears to be mediated primarily through modulation of the BM microenvironment during leukemia establishment and early progression.
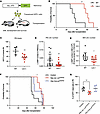 Figure 2
Lxn deletion in niche attenuates MLL-AF9–induced (MA9-induced) leukemia development. (A) Schematic diagram of MLL-AF9–induced AML development via retroviral transduction and transplantation into WT and Lxn–/– recipient mice. (B) Kaplan-Meier survival curves of AML mice in Lxn–/– or WT recipient mice. Statistical significance was determined using the log-rank (Mantel-Cox) test. (C) GFP+ leukemic blast percentages in peripheral blood (PB) of AML WT or Lxn–/– recipient mice. Data are shown as mean ± SD for the indicated number of mice from 2 independent experiments. (D and E) Absolute number of leukemic stem cells (LSCs), identified as L-GMPs, in the PB and BM of AML WT or Lxn–/– recipient mice. Data are shown as mean ± SD for the indicated number of mice from 3 independent experiments. (F) Kaplan-Meier survival curves of AML developed in the control, Nes-Cre; Lxn loxp/loxp, or Osx-Cre; Lxn loxp/loxp conditional KO recipient mice. Overall differences were analyzed using the log-rank (Mantel-Cox) test, followed by pairwise comparisons with Holm-Šídák correction for multiple testing. (G) GFP+ leukemic blast percentages in PB of AML developed in the control, Nes-Cre; Lxn loxp/loxp, or Osx-Cre; Lxn loxp/loxp conditional KO recipient mice. Data are shown as mean ± SD for the indicated number of mice from a single experiment. A 2-tailed, unpaired Student’s t test was performed in C–E. One-way ANOVA was used for comparisons among multiple groups in G. *P < 0.05, **P < 0.01.
Since MSCs and OBs are altered in normal Lxn–/– niche, we used Nes-Cre: Lxnloxploxp and Osx-Cre: Lxnloxp/loxp as the recipients and used the same strategy to induce AML in these mice. The results show that Nes-Cre: Lxnloxploxp recipients had a significantly higher median survival (73 days) than the litter-mate control group (51 days), while Osx-Cre: Lxnloxp/loxp recipients showed a trend of survival advantage but without statistical significance (Figure 2F). Consistently, the percentage of GFP+ blast cells in PB were significantly lower in Nes-Cre: Lxnloxp/loxp, but not Osx-Cre: Lxnloxp/loxp recipients, compared with the control group (Figure 2G). These data suggest that Lxn deletion in the BM niche, particularly within MSCs, reduces LSC and blast quantity, thus suppressing AML progression through microenvironment-dependent mechanisms. We therefore next investigated how Lxn deficiency alters stromal cell composition and stromal-leukemia communication networks.
LIFR signaling is downregulated in Lxn–/– AML niche. To further understand the cellular and molecular changes in Lxn–/– AML niche, we performed the scRNA-seq on stromal and hematopoietic cells from WT and Lxn–/– mice under homeostatic (non-AML) and AML conditions. Stromal cells were sorted as CD45–, Lin–, Ter119–, CD71–, and 7-AAD– population, while hematopoietic cells were Lin– in the non-AML condition and GFP+ in the AML condition. After quality control, around 12,000 cells were sequenced in each sample. Merging all samples and unsupervised clustering revealed distinct stromal and hematopoietic populations (Figure 3A). Under AML conditions, dominant monocytic blast populations largely replaced the normal hematopoietic hierarchy (Figure 3B and Supplemental Figure 4A). In parallel, AML profoundly remodeled the BM niche, with MSC1 emerging as the predominant mesenchymal population and replacing fibroblasts as a major stromal component (Figure 3B).
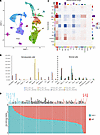 Figure 3
scRNA-seq on stromal and hematopoietic (or leukemic) cells from WT and Lxn–/– homeostatic (non-AML) and AML mice. (A) The UMAP clustering of all 8 individual scRNA-seq samples on stromal and hematopoietic (or leukemic) cells from WT and Lxn–/– (KO) homeostatic (non-AML) (Pre-) and AML (Post-) mice. Three distinct cell populations were identified, including stromal cells, hematopoietic cells, and MLL-AF9 blast cells. (B) The proportional distribution of hematopoietic (Lin–), leukemic (GFP), and stromal clusters in the BM of WT and Lxn–/– (KO) homeostatic (non-AML) (Pre-) and AML (Post-) mice. (C) CellChat analysis reveals the differential interaction strength of stromal and leukemic cells between AML post-WT and post-KO cells. CellChat function netVisual_heatmap was used to visualize changes in cell-cell communication strength between WT and Lxn-KO samples. In this heatmap, the top bar represents the total incoming signaling strength (sum of column values) for each cell population, whereas the right bar represents the total outgoing signaling strength (sum of row values). Within the heatmap, red indicates increased interaction strength in the Lxn KO condition relative to WT, while blue indicates decreased interaction strength. The MSC1 population on the y axis and the MonoP blast population on the x axis are highlighted with red lines. Their interaction is indicated by the red arrow, representing the strongest cell-cell interaction. (D) Relative information flow comparison of ligand-receptor signaling pathways between WT and Lxn–/– cells. We compared signaling pathway activity between WT and Lxn–/– samples by calculating the information flow for each pathway, defined as the sum of communication probabilities across all interacting cell populations within the inferred signaling network. Signaling pathways were then ranked according to the difference in overall information flow between the 2 conditions. In the resulting plot, pathways with higher information flow in WT are displayed in red, whereas pathways with higher information flow in Lxn KO are displayed in green.
To determine the molecular mechanisms, we identified differentially expressed genes in various stromal clusters under normal and AML conditions (Supplemental Tables 1–4). To investigate potential communication networks between stromal cells and leukemic cells, we performed CellChat analysis on the scRNA-seq dataset. The inferred cell-cell communication network revealed that MSC1 exhibited the highest predicted interaction probability, with leukemia blasts among the stromal cell populations analyzed (Figure 3C). In our dataset, MSC1 was characterized by high expression of canonical mesenchymal niche genes that support hematopoiesis, including Cxcl12 and Lepr, together with moderate expression of Pdgfra (Supplemental Figure 4B). This observation is consistent with our transplantation studies (Figure 2F), suggesting an important role for MSC in supporting leukemia progression. Comparison of signaling pathway activity between WT and Lxn–/– niches further identified several receptor/ligand pathways, including Oncostatin M (OSM), vitronectin (VTN), and LIFR signaling, that displayed substantially higher information flow in the WT condition than in the Lxn–/– condition (Figure 3D). The results suggest that these pathways may contribute to leukemia-supportive interactions within the WT BM microenvironment, whereas Lxn deletion remodels stromal-leukemia communication networks and reduces the activity of these pathways.
OSM, a member of IL-6 family, plays an important role in inflammation (46). GSEA of WT and Lxn–/– AML niches revealed the downregulation of IL-6 pathways in the Lxn–/– AML niche (Supplemental Figure 4C). OSM signals primarily through two types of receptor complexes: the type I receptor, a heterodimer of GP130 and LIFR, and the type II receptor, a heterodimer of GP130 and OSMR (46, 47). We examined the expression of these receptors in each stromal cluster and found that only Lifr was significantly downregulated in the MSC1 cluster (Supplemental Tables 1–4). To validate these findings, we performed qPCR using cultured MSCs according to our previously published protocol (48). We first evaluated whether cultured MSCs share features with the MSC1 population. We examined the expression of key MSC marker genes identified in our scRNA-seq dataset, including Sca1, Cxcl12, Lepr, and Pdgfra, by qPCR. Cultured MSCs expressed high levels of Cxcl12 and Sca1, moderate levels of Pdgfra, and very low levels of Lepr (Supplemental Figure 4D). These findings indicate that high Cxcl12 expression and moderate Pdgfra expression are common features shared by MSC1 and cultured BM-MSCs. Compared with WT MSCs, Lxn–/– MSCs exhibited significantly reduced expression of Lifr and Gp130, while the expression of other LIFR signaling components, including Osmr, was unchanged (Figure 4A). We further assessed the protein expression of these receptors and found that only LIFR expression was decreased in Lxn–/– MSCs, whereas GP130 and OSMR expression remained unchanged (Figure 4B). These results suggest a downregulation of LIFR signaling in the Lxn–/– niche. LIFR signals through downstream JAK/STAT3, MAPK/ERK, and PI3K/AKT pathways (49–51). We found that p-STAT3 and p-ERK expression was decreased in Lxn–/– MSCs (Figure 4, C and D). Taken together, these data suggest that Lxn deletion leads to the downregulation of LIFR signaling in MSCs, which suppresses the leukemia development.
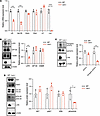 Figure 4
Lxn deficiency in MSCs downregulates LIFR signaling pathways. (A) qPCR analysis of mRNA expression levels of Lifr, Gp130, Osmr, Osm, Lif, and Lxn in cultured BM-derived MSCs from WT and Lxn–/– mice. (B) Western blot of LIFR, GP130, and OSMR protein expression in cultured BM-derived MSCs from WT and Lxn–/– mice. Densitometric quantification is shown on the right. Actin was used as a control. (C) Western blot of total STAT3 and phosphorylated STAT3 (p-STAT3) in cultured BM-derived MSCs from WT and Lxn–/– mice. Densitometric quantification is shown on the right. Actin was used as a control. (D) Western blot of total and phosphorylated forms of AKT and ERK in cultured BM-derived MSCs from WT and Lxn–/– mice. Densitometric quantification is shown on the right. Actin was used as a control. Data are shown as mean ± SD for the indicated number of replicates from a single experiment. A 2-tailed, unpaired Student’s t test was performed. *P < 0.05, **P < 0.01,***P < 0.001, ****P < 0.0001.
LIFR downregulation enhances immune surveillance in the AML Lxn–/– niche. LIFR signaling activation promotes cancer progression and is associated with poor prognosis in multiple malignancies (50, 51). In addition, LIFR signaling has been implicated in shaping the immune landscape of AML through regulation of T cell responses, macrophage function, and cytokine production. We therefore investigated whether Lxn deletion alters immune and cytokine profiles within the AML BM niche. Flow cytometric analysis revealed a significant increase in both percentages and numbers of CD8+ and CD4+ T cells in the BM of Lxn–/– AML mice compared with WT AML controls (Figure 5, A and B). CD8+ T cells are key mediators of antileukemia immunity through their ability to directly eliminate leukemic cells. To further assess the functional status of T cells, we examined PD-1 expression on CD8+ effector and memory T cell subsets. Notably, PD-1 expression was significantly reduced on CD8+ effector T cells from Lxn–/– AML mice compared with WT AML mice (Figure 5C), suggesting a less exhausted and potentially more effective antileukemia T cell response in the Lxn–/– niche. We examined the frequencies of neutrophils, macrophages, dendritic cells, NK cells, and B cells and found that they were comparable between WT and Lxn–/– AML mice (Supplemental Figure 5A). Furthermore, no significant differences in percentages of CD8+ and CD4+ T cells were observed between homeostatic (non-AML) WT and Lxn–/– BM (Supplemental Figure 5B), suggesting that Lxn deletion specifically modulates T cell responses in the leukemic microenvironment.
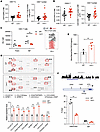 Figure 5
Lxn–/– niche increases Cxcl9-mediated T cell accumulation. (A) Percentages (left panel) and absolute numbers (right panel) of CD8+ T cells in the BM of WT or Lxn–/– AML mice. Data are shown as mean ± SD for the indicated number of mice from 3 independent experiments. (B) Percentages (left panel) and absolute numbers (right panel) of CD4+ T cells in the BM of WT or Lxn–/– AML mice. Data are shown as mean ± SD for the indicated number of mice from 3 independent experiments. (C) PD-1 level (mean fluorescence intensity, MFI) in CD8+ T memory and effector cells (left panel) and representative flow cytometry profiles (right panel) in the BM of WT or Lxn–/– AML mice. Data are shown as mean ± SD for the indicated number of mice from a single experiment. (D) Cytokine array analysis of BM fluid from WT and Lxn–/– AML mice. Differentially expressed cytokines are highlighted (top panel). Quantification of signal intensities is shown on the bottom panel. Chemiluminescent signals were quantified using ImageJ after background subtraction and normalized to the internal positive control spots of each membrane. Relative expression was calculated by setting the WT group as 1. Data are shown as mean ± SD from a single experiment with a duplicate. (E) ELISA of CXCL9 in the BM fluid of WT and Lxn–/– AML mice. Data are shown as mean ± SD for the indicated number of mice from a single experiment. (F) H3K27me3 binding at the Cxcl9 promoter region (UCSC Genome Browser, top panel). Schematic of primers used for ChIP-qPCR (middle panel). ChIP-qPCR using an H3K27me3 antibody shows reduced H3K27me3 occupancy at the Cxcl9 promoter in Lxn–/– MSCs compared with WT MSCs (bottom panel). IgG served as a negative control. Data are shown as mean ± SD for the indicated number of samples from a single experiment. A 2-tailed, unpaired Student’s t test was performed. *P < 0.05, **P < 0.01, ***P < 0.001.
LIFR signaling modulates immune responses by regulating chemokine expression (49, 50, 52). We thus performed a cytokine array on the BM fluid of WT and Lxn–/– AML mice and identified several cytokines with altered expression (Figure 5D). Among them, CXCL9 emerged as the top candidate, as it is a downstream target of LIFR signaling and plays a role in modulating tumor immune microenvironment (52). Increased levels of CXCL9 in the Lxn–/– AML niche were further confirmed by ELISA (Figure 5E). It has been reported that LIFR signaling promotes the binding of repressive histone marks, H3K27me3, at the Cxcl9 promoter, thus suppressing its transcription (52). We hypothesized that downregulation of LIFR signaling in Lxn–/– MSCs results in reduced H3K27me3 binding to the Cxcl9 promoter, leading to increased Cxcl9 expression. To test this, we performed the ChIP-qPCR in WT and Lxn–/– MSCs using H3K27me3 antibody and found that less H3K27me3 bound to the Cxcl9 promoter in Lxn–/– MSCs (Figure 5F). This result further confirms that Lxn deletion causes downregulation of Lifr, which leads to Cxcl9 upregulation. The increased level of Cxcl9 facilitates the recruitment of T cells to the AML niche, thereby enhancing immune surveillance.
Lxn deletion in the niche increases T cell–mediated cytotoxicity of AML cells via CXCL9. Given the accumulation of T cells and the increased CXCL9 level in the Lxn–/– AML niche, we hypothesize that CXCL9 promotes T cell recruitment, thus enhancing the cytotoxicity of AML cells. To test this, we established a transwell coculture system in which MSCs and MA9-AML cells were placed at the bottom, while CD8+ T cells were on the top (Figure 6A). Lxn–/– MSCs significantly promoted the recruitment of CD8+ T cells compared with WT MSCs, as shown by the increased fold of CD8+ T cells migrating to the lower chamber (Figure 6B). Concomitantly, the number of AML cells was significantly reduced in the presence of Lxn–/– MSC (Figure 6C), and their apoptosis was increased (Figure 6D). The result indicates that Lxn–/– MSCs promote CD8+ T cell migration and enhances T cell–mediated cytotoxicity.
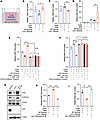 Figure 6
Lxn–/– MSCs enhance CD8+ T cell–mediated cytotoxicity against AML cells through CXCL9. (A) Schematic representation of the transwell coculture system in which MSCs and MA9-AML cells were placed in the lower chamber, and CD8+ T cells were placed in the upper chamber. (B) Quantification of CD8+ T cells migrating into the lower chamber after coculture with WT or Lxn–/– MSCs, demonstrating enhanced T cell recruitment by Lxn–/– MSCs. (C) Relative MA9 AML cell number after coculture, showing reduced AML cell survival cultured with the Lxn–/– MSCs. (D) Relative dead cells in CD8 T cells cocultured with WT or Lxn–/– MSCs and MA9 cells, showing increased cell death in the Lxn–/– MSCs. (E and F) Neutralization of CXCL9 or inhibition of CXCR3 signaling via AMG-487 (1 μM) in the transwell system abolished the enhanced CD8+ T cell recruitment (E) and AML cell killing (F) induced by Lxn–/– MSCs. In B, C, E, and F, the number of migrated CD8+ T cells is presented as relative fold change normalized to the CD8 T and MA9-AML cells coculture group, which was set to 1. (G–I) Lifr was overexpressed in Lxn–/– MSCs, and then cocultured with MA9-AML cells and CD8+ T cells. Lifr overexpression increased STAT3 phosphorylation (G), reduced CD8+ T cell migration (H), and increased AML cell survival (I). Data are shown as mean ± SD for the indicated number of samples from a single experiment. Comparisons among 3 or more groups were performed using 1-way ANOVA followed by Tukey’s multiple-comparisons test. *P < 0.05, **P < 0.01, ***P < 0.001, ****P < 0.0001.
To determine whether this effect was mediated by CXCL9, we added either a CXCL9-neutralizing antibody or its receptor (CXCR3) inhibitor AMG 487 (a selective small-molecule CXCR3 antagonist) to the coculture system. Both treatments significantly reduced CD8+ T cell recruitment and abolished the enhanced AML killing effect of Lxn–/– MSCs (Figure 6, E and F). These results demonstrate that Lxn deficiency in MSCs facilitates CXCL9-dependent recruitment and activation of CD8+ T cells, thereby promoting immune-mediated clearance of AML cells.
Our CellChat analysis identified LIFR signaling as one of the pathways significantly attenuated in the Lxn–/– niche. To determine whether reduced LIFR signaling contributes to the enhanced immune response, we restored Lifr expression in Lxn–/– MSCs before coculture with MA9-AML cells and CD8+ T cells. Lifr overexpression effectively reversed the Lxn–/– phenotype, as evidenced by increased STAT3 phosphorylation (Figure 6G), reduced CD8+ T cell migration (Figure 6H), and increased AML cell survival (Figure 6I). Together, these findings identify reduced LIFR signaling as an upstream regulator of the CXCL9-dependent recruitment of CD8+ T cells and the AML-suppressive effects associated with Lxn deficiency.
Lxn deletion in the niche further enhances the immunotherapy efficacy of AML. AML cells themselves can upregulate PD-L1 and other inhibitory immune checkpoint molecules for immune evasion (53). Although immune checkpoint blockade has shown remarkable efficacy in several solid tumors, clinical studies of PD-1/PD-L1 inhibitors in AML have generally demonstrated limited activity when used as monotherapy (54). Nevertheless, emerging evidence suggests that combination strategies targeting both leukemia cells and the immunosuppressive BM microenvironment may enhance therapeutic efficacy. CD8+ effector T cells from Lxn–/– AML mice exhibited significantly reduced PD-1 expression compared with WT AML controls, indicating altered regulation of immune checkpoint receptor expression within the leukemic microenvironment. Given the central role of the PD-1/PD-L1 axis in suppressing antitumor immunity, we next examined whether PD-1 blockade could further enhance antileukemia responses in the context of Lxn-deficient niches. We evaluated the therapeutic efficacy of combining anti–PD-1 treatment with Lxn niche deletion in AML mouse models. Mice transplanted with MA9-transduced LSCs were administered anti–PD-1 monoclonal antibody (CD279, clone RMP1-14; Bio X Cell) on days 21, 28, and 35 after transplantation at a dose of 200 μg per injection. The anti–PD-1 antibody binds PD-1 on T cells, blocking its interaction with PD-L1, thereby relieving PD-1–mediated inhibitory signaling and sustaining T cell activation and cytotoxic anti-leukemia responses. Percentages of GFP+ cells were measured on day 17 (before treatment) and day 42 (3 weeks after treatment) after transplantation and the mouse survival was observed (Figure 7A). The results show that combination of anti–PD-1 treatment with Lxn niche depletion led to the lowest level of leukemic blasts in the blood (Figure 7B). Additionally, weight loss was minimal (Figure 7C), and survival was significantly increased (Figure 7D). These findings suggest that Lxn deletion in the niche improves the efficacy of AML anti-PD1 immunotherapy.
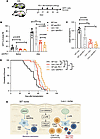 Figure 7
Lxn deletion in the niche enhances anti–PD-1 treatment efficacy of AML. (A) Experimental scheme for anti–PD-1 antibody treatment in MLL-AF9–driven AML mouse model. (B) Percentages of GFP+ leukemic blasts in PB at day 17 (pretreatment) and day 42 (posttreatment) after transplantation. Data are shown as mean ± SD for the indicated number of mice from a single experiment. (C) Weight loss of leukemic mice on day 42 after anti–PD-1 treatment compared with baseline. Data are shown as mean ± SD for the indicated number of mice from a single experiment. (D) Kaplan-Meier survival curve of leukemic mice with or without anti–PD-1 treatment. WT control (Con) group, n = 19; Lxn–/– Con group, n = 20; WT anti–PD-1 group, n = 15; and Lxn–/– anti–PD-1 group, n = 15. Overall differences were analyzed using the log-rank (Mantel-Cox) test, followed by pairwise comparisons with Holm-Šídák correction for multiple testing. Data are shown as mean ± SD for the indicated number of mice from 3 independent experiments. (E) Model of Lxn deletion in the BM niche and its effect on MLL-AF9 AML. Loss of Lxn downregulates LIFR signaling, leading to increased CXCL9 expression. Elevated CXCL9 recruits more cytotoxic CD8+ T cells, enhancing AML cell killing. Comparisons among 3 or more groups were performed using 1-way ANOVA followed by Tukey’s multiple-comparisons test. *P < 0.05, **P < 0.01, ***P < 0.001.


