
Research ArticleHematologyImmunology
Open Access |  10.1172/jci.insight.199156
GZMK-expressing tissue-resident memory CD8+ T cells participate in human intestinal acute graft-versus-host disease
Yiming Sun,1,2 Yutong Xue,1,2 Chenyuyao Song,1,2 Xinyu Liu,1,2 Ruoyang Shao,1,2 Zhiping Fan,1,2 Ren Lin,1,2 Fen Huang,1,2 Na Xu,1,2 Li Xuan,1,2 Min Dai,1,2 Jing Sun,1,2 Qifa Liu,1,2 and Hua Jin1,2
1Department of Hematology, Nanfang Hospital, Southern Medical University, Guangzhou, China.
2Clinical Medical Research Center of Hematological Diseases of Guangdong Province, Guangzhou, China.
Address correspondence to: Hua Jin or Qifa Liu, Department of Hematology, Nanfang Hospital, Southern Medical University, 1838 Guangzhou Avenue North, Guangzhou 510515, China. Phone: 86.020.61641612; Email: echohua1124@163.com (HJ). Phone: 86.020.61641611; Email: liuqifa628@163.com (QL).
Authorship note: YS and YX contributed equally to this work.
Find articles by Sun, Y. in: PubMed | Google Scholar
1Department of Hematology, Nanfang Hospital, Southern Medical University, Guangzhou, China.
2Clinical Medical Research Center of Hematological Diseases of Guangdong Province, Guangzhou, China.
Address correspondence to: Hua Jin or Qifa Liu, Department of Hematology, Nanfang Hospital, Southern Medical University, 1838 Guangzhou Avenue North, Guangzhou 510515, China. Phone: 86.020.61641612; Email: echohua1124@163.com (HJ). Phone: 86.020.61641611; Email: liuqifa628@163.com (QL).
Authorship note: YS and YX contributed equally to this work.
Find articles by Xue, Y. in: PubMed | Google Scholar
1Department of Hematology, Nanfang Hospital, Southern Medical University, Guangzhou, China.
2Clinical Medical Research Center of Hematological Diseases of Guangdong Province, Guangzhou, China.
Address correspondence to: Hua Jin or Qifa Liu, Department of Hematology, Nanfang Hospital, Southern Medical University, 1838 Guangzhou Avenue North, Guangzhou 510515, China. Phone: 86.020.61641612; Email: echohua1124@163.com (HJ). Phone: 86.020.61641611; Email: liuqifa628@163.com (QL).
Authorship note: YS and YX contributed equally to this work.
Find articles by Song, C. in: PubMed | Google Scholar
1Department of Hematology, Nanfang Hospital, Southern Medical University, Guangzhou, China.
2Clinical Medical Research Center of Hematological Diseases of Guangdong Province, Guangzhou, China.
Address correspondence to: Hua Jin or Qifa Liu, Department of Hematology, Nanfang Hospital, Southern Medical University, 1838 Guangzhou Avenue North, Guangzhou 510515, China. Phone: 86.020.61641612; Email: echohua1124@163.com (HJ). Phone: 86.020.61641611; Email: liuqifa628@163.com (QL).
Authorship note: YS and YX contributed equally to this work.
Find articles by Liu, X. in: PubMed | Google Scholar
1Department of Hematology, Nanfang Hospital, Southern Medical University, Guangzhou, China.
2Clinical Medical Research Center of Hematological Diseases of Guangdong Province, Guangzhou, China.
Address correspondence to: Hua Jin or Qifa Liu, Department of Hematology, Nanfang Hospital, Southern Medical University, 1838 Guangzhou Avenue North, Guangzhou 510515, China. Phone: 86.020.61641612; Email: echohua1124@163.com (HJ). Phone: 86.020.61641611; Email: liuqifa628@163.com (QL).
Authorship note: YS and YX contributed equally to this work.
Find articles by Shao, R. in: PubMed | Google Scholar
1Department of Hematology, Nanfang Hospital, Southern Medical University, Guangzhou, China.
2Clinical Medical Research Center of Hematological Diseases of Guangdong Province, Guangzhou, China.
Address correspondence to: Hua Jin or Qifa Liu, Department of Hematology, Nanfang Hospital, Southern Medical University, 1838 Guangzhou Avenue North, Guangzhou 510515, China. Phone: 86.020.61641612; Email: echohua1124@163.com (HJ). Phone: 86.020.61641611; Email: liuqifa628@163.com (QL).
Authorship note: YS and YX contributed equally to this work.
Find articles by Fan, Z. in: PubMed | Google Scholar
1Department of Hematology, Nanfang Hospital, Southern Medical University, Guangzhou, China.
2Clinical Medical Research Center of Hematological Diseases of Guangdong Province, Guangzhou, China.
Address correspondence to: Hua Jin or Qifa Liu, Department of Hematology, Nanfang Hospital, Southern Medical University, 1838 Guangzhou Avenue North, Guangzhou 510515, China. Phone: 86.020.61641612; Email: echohua1124@163.com (HJ). Phone: 86.020.61641611; Email: liuqifa628@163.com (QL).
Authorship note: YS and YX contributed equally to this work.
Find articles by Lin, R. in: PubMed | Google Scholar
1Department of Hematology, Nanfang Hospital, Southern Medical University, Guangzhou, China.
2Clinical Medical Research Center of Hematological Diseases of Guangdong Province, Guangzhou, China.
Address correspondence to: Hua Jin or Qifa Liu, Department of Hematology, Nanfang Hospital, Southern Medical University, 1838 Guangzhou Avenue North, Guangzhou 510515, China. Phone: 86.020.61641612; Email: echohua1124@163.com (HJ). Phone: 86.020.61641611; Email: liuqifa628@163.com (QL).
Authorship note: YS and YX contributed equally to this work.
Find articles by Huang, F. in: PubMed | Google Scholar
1Department of Hematology, Nanfang Hospital, Southern Medical University, Guangzhou, China.
2Clinical Medical Research Center of Hematological Diseases of Guangdong Province, Guangzhou, China.
Address correspondence to: Hua Jin or Qifa Liu, Department of Hematology, Nanfang Hospital, Southern Medical University, 1838 Guangzhou Avenue North, Guangzhou 510515, China. Phone: 86.020.61641612; Email: echohua1124@163.com (HJ). Phone: 86.020.61641611; Email: liuqifa628@163.com (QL).
Authorship note: YS and YX contributed equally to this work.
Find articles by Xu, N. in: PubMed | Google Scholar
1Department of Hematology, Nanfang Hospital, Southern Medical University, Guangzhou, China.
2Clinical Medical Research Center of Hematological Diseases of Guangdong Province, Guangzhou, China.
Address correspondence to: Hua Jin or Qifa Liu, Department of Hematology, Nanfang Hospital, Southern Medical University, 1838 Guangzhou Avenue North, Guangzhou 510515, China. Phone: 86.020.61641612; Email: echohua1124@163.com (HJ). Phone: 86.020.61641611; Email: liuqifa628@163.com (QL).
Authorship note: YS and YX contributed equally to this work.
Find articles by Xuan, L. in: PubMed | Google Scholar
1Department of Hematology, Nanfang Hospital, Southern Medical University, Guangzhou, China.
2Clinical Medical Research Center of Hematological Diseases of Guangdong Province, Guangzhou, China.
Address correspondence to: Hua Jin or Qifa Liu, Department of Hematology, Nanfang Hospital, Southern Medical University, 1838 Guangzhou Avenue North, Guangzhou 510515, China. Phone: 86.020.61641612; Email: echohua1124@163.com (HJ). Phone: 86.020.61641611; Email: liuqifa628@163.com (QL).
Authorship note: YS and YX contributed equally to this work.
Find articles by Dai, M. in: PubMed | Google Scholar
1Department of Hematology, Nanfang Hospital, Southern Medical University, Guangzhou, China.
2Clinical Medical Research Center of Hematological Diseases of Guangdong Province, Guangzhou, China.
Address correspondence to: Hua Jin or Qifa Liu, Department of Hematology, Nanfang Hospital, Southern Medical University, 1838 Guangzhou Avenue North, Guangzhou 510515, China. Phone: 86.020.61641612; Email: echohua1124@163.com (HJ). Phone: 86.020.61641611; Email: liuqifa628@163.com (QL).
Authorship note: YS and YX contributed equally to this work.
Find articles by Sun, J. in: PubMed | Google Scholar
1Department of Hematology, Nanfang Hospital, Southern Medical University, Guangzhou, China.
2Clinical Medical Research Center of Hematological Diseases of Guangdong Province, Guangzhou, China.
Address correspondence to: Hua Jin or Qifa Liu, Department of Hematology, Nanfang Hospital, Southern Medical University, 1838 Guangzhou Avenue North, Guangzhou 510515, China. Phone: 86.020.61641612; Email: echohua1124@163.com (HJ). Phone: 86.020.61641611; Email: liuqifa628@163.com (QL).
Authorship note: YS and YX contributed equally to this work.
Find articles by Liu, Q. in: PubMed | Google Scholar
1Department of Hematology, Nanfang Hospital, Southern Medical University, Guangzhou, China.
2Clinical Medical Research Center of Hematological Diseases of Guangdong Province, Guangzhou, China.
Address correspondence to: Hua Jin or Qifa Liu, Department of Hematology, Nanfang Hospital, Southern Medical University, 1838 Guangzhou Avenue North, Guangzhou 510515, China. Phone: 86.020.61641612; Email: echohua1124@163.com (HJ). Phone: 86.020.61641611; Email: liuqifa628@163.com (QL).
Authorship note: YS and YX contributed equally to this work.
Find articles by Jin, H. in: PubMed | Google Scholar
Published July 22, 2026 - More info
JCI Insight. 2026;11(14):e199156. https://doi.org/10.1172/jci.insight.199156.
© 2026 Sun et al. This work is licensed under the Creative Commons Attribution 4.0 International License. To view a copy of this license, visit http://creativecommons.org/licenses/by/4.0/.
Received: August 14, 2025; Accepted: May 19, 2026


-
Results
Donor-derived CD8+ TRM cells are enriched in the intestines of patients with aGVHD. To gain insight into the mechanisms of the pathophysiology of intestinal aGVHD, we analyzed intestinal biopsy samples from 65 patients who received allo-HSCT (50 patients with intestinal aGVHD and 15 patients without intestinal aGVHD) and 12 untransplanted healthy controls (HCs) (26). Detailed clinical and pathological information are provided in Supplemental Table 1 (supplemental material available online with this article; https://doi.org/10.1172/jci.insight.199156DS1). Baseline patient characteristics did not significantly differ between the groups with and without intestinal aGVHD (Table 1, columns 2 and 3). Compared with those in untransplanted HCs and patients without intestinal aGVHD, endoscopic findings in patients with intestinal aGVHD demonstrated mucosal inflammation, including edema, erythema, erosions, superficial ulcerations, sloughing, and denudation. aGVHD intestines also exhibited the typical histopathology of aGVHD, including lymphocytic infiltration, epithelial cell apoptosis, and crypt dropout, and significantly increased CD8+ T cell infiltration (P < 0.0001 and P < 0.01; Figure 1A). We isolated CD8+ T cells from the intestinal tissues of 4 patients with intestinal aGVHD and matched peripheral blood for whole-transcriptome and VDJ profiling via scRNA-seq, after which we paired single-cell T cell receptor sequencing (scTCR-seq) to obtain the basic properties of the CD8+ T cell subsets (27) (Figure 1B). The distributions of the CD8+ T cell clusters within the peripheral blood and intestinal tissue differed; specifically, the C1:CD8+ TRM cluster was almost exclusively located in the intestinal tissue (28, 29), whereas the other clusters were prevalent in the peripheral blood (Supplemental Figure 1). Accordingly, the CD8+ TRM cluster exhibited significant enrichment of the tissue residency signature, along with a decreased core circulating signature, compared with the other clusters (11) (P < 0.0001; Figure 2, A and B, and Supplemental Figure 1D). To further determine the heterogeneity of the CD8+ TRM cluster compared with the other clusters, we identified 5,619 differentially expressed genes (DEGs), including 367 upregulated genes and 5,252 downregulated genes (Supplemental Table 2). Compared with the other clusters, CD8+ TRM clusters in the intestine demonstrated downregulated S1PR1 (encoding a CD69 antagonist) and its transcription factor KLF2, the related Kruppel-like transcription factor KLF3, the chemokine receptor CX3CR1, and the lymph node–homing molecules SELL (CD62L) and CCR7, all of which control T cell egress, migration and tissue retention (30). Conversely, in addition to the canonical TRM marker CD69, the CD8+ TRM cluster exhibited upregulated expression of classical TRM-associated genes, including the adhesion molecules ITGAE (CD103) and ITGA1 (CD49A) (18, 31); the chemokine receptors CXCR4 and CXCR6 (31); regulatory molecules of G protein signaling (RGS1 and RGS2) (18); and the inhibitory markers LAYN, CTLA4, HAVCR2 (TIM3), LAG3, and PDCD1 (PD-1) (18, 31) (Figure 2C). Furthermore, gene set enrichment analysis (GSEA) and the Aucell algorithm were used to validate the tissue-residency signature of the CD8+ TRM cluster (18, 31, 32) (P < 0.0001; Figure 2D and Supplemental Figure 1D). The CD8+ TRM cluster also exhibited upregulated pathways involved in GVHD, proinflammation, and T cell proliferation compared with the other circulating counterparts (Figure 2E). The presence of CD8+ TRM cells in the intestinal tissue was further confirmed using mIHC staining of CD8 and CD69, which was consistent with the results of previous reports (4, 33). Among patients who received sex-mismatched allo-HSCT and achieved complete donor chimerism status in the peripheral blood, we validated that the majority of intestinal CD8+ TRM cells were of donor origin by performing combined mIHC, fluorescence in situ hybridization of X and Y chromosomes (FISH-XY), and souporcell analysis at the scRNA-seq level (Figure 2, F and G, and Supplemental Figure 1E). Therefore, donor-derived CD8+ TRM cells are enriched in the intestines of patients with aGVHD.
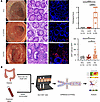 Figure 1
CD8+ T cells are enriched in the intestines of patients with aGVHD. (A) Representative endoscopic images, histopathology staining, and immunostaining of CD8+ T cells (left) and histologic grading and CD8+ T cell quantification (right) in patients who received allo-HSCT with intestinal aGVHD (n = 12), without aGVHD (n = 15), and healthy controls (HCs) (n = 50). HPF, high-power field (×40). **P < 0.01; ****P < 0.0001 according to the Wilcoxon test. Scale bars: 100 μm. (B) CD8+ T cells were sorted from the intestinal tissues and peripheral blood (PB) of aGVHD patients for scRNA-seq and scTCR-seq analyses.
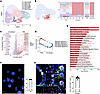 Figure 2
Donor-derived CD8+ TRM cells are enriched in the intestines of aGVHD patients. (A) Uniform manifold approximation and projection (UMAP) plot of 46,346 CD8+ T cells from 4 intestinal aGVHD patients, which demonstrated subclustering of CD8+ T cells into 7 phenotypes. Each dot represents a single cell (left). (B) Left: UMAP plot of the distribution of CD8+ T cell clusters separated according to intestinal tissues and peripheral blood (PB). Right: Stacked bar plots of the distribution of CD8+ T cell clusters in each sample. (C) Volcano plots showing the differentially expressed genes (DEGs) between CD8+ resident memory T (TRM) cells and CD8+ circulating T cells. Benjamini-Hochberg–adjusted P values ≤ 0.05 and log2(fold change) (log2FC) values ≥ 0.25 were calculated via the Wilcoxon rank-sum test. Respective genes were annotated. (D) Gene set enrichment analysis (GSEA) curves for resident and circulating signatures in CD8+ TRM cells and CD8+ circulating T cells. (E) GSEA (KEGG, HALLMARK, and GO) analyses were performed on highly expressed genes in CD8+ TRM cells. (F) Left: Representative image of FISH for X (green) and Y (red) chromosomes in the peripheral blood mononuclear cells (PBMCs) of an allo-HSCT patient (female recipient received male allograft). Right: Proportion of donor cells in PBMCs (n = 14). (G) Representative image of combined immunostaining and FISH-XY in the intestine of an allo-HSCT patient (female recipient received male allograft). Left: The white boxes indicate donor CD8+CD69+ TRM cells. Right: Proportion of donor TRM cells in intestinal TRM cells (n = 14). Scale bars: 20 μm (F and G).
GZMK-expressing CD8+ TRM subset is associated with intestinal aGVHD. We performed further analyses of CD8+ T cells from 11 intestinal biopsy samples after allo-HSCT (7 with intestinal aGVHD and 4 without intestinal aGVHD) to characterize the intrinsic structure and potential functional subsets of CD8+ T cells. As an untransplanted HC cohort, we integrated a published dataset of 3 healthy individuals from the human gut CD8+ TRM cell atlas (34). We identified 7 distinct clusters according to the gene expression profile and paired VDJ profile (Figure 3A and Supplemental Figure 2A). The first cluster, which was the mucosal-associated invariant T (MAIT) cell cluster, expressed high levels of the MAIT marker genes KLRB1 (CD161), TRAV1-2, IL7R (CD127), and SLC4A10 (35, 36). The second cluster, which was an NKT/γδ T cell cluster, expressed high levels of GNLY, NCAM1, NCR1, KLRC1, and TRDC with a TRM phenotype (Figure 3B) (36, 37). Based on previous published markers, the TRM cells were stringently transcriptomically defined by (a) intrinsically high expression of tissue retention molecules (CD69, ITGA1 [CD49A], ITGAE [CD103], ITGB2 [CD18], ITGAL [LFA-1]); (b) the absence of receptors necessary for lymph node homing (SELL [CD62L], CCR7); (c) upregulation of specific chemokines and chemokine receptors (CXCR6); and (d) genes encoding TRM markers (RUNX3) (11, 31, 38, 39). After the strict redefinition and further TRM scoring (Figure 3C), the third cluster, which was TRM-like recirculating-stem CD8+ T cell (TRM-like CD8+ Trecir-stem) cluster, specifically expressed “stemness” marker genes such as TCF7, LEF1, CCR7, and SELL (40, 41). The fourth cluster, which was the GZMK-expressing CD8+ TRM (GZMK+CD8+ TRM), was characterized by high expression of GZMK, ITGA1, GZMM, and CXCR4 (42-45). The fifth cluster, which was the CX3CR1-expressing CD8+ TRM (CX3CR1+CD8+ TRM) cluster, expressed high levels of the effector marker genes CX3CR1, GZMB, FGFBP2, and KLRG1. The sixth cluster, which was the TIGIT-expressing CD8+ TRM (TIGIT+CD8+ TRM) cluster, expressed high levels of the exhausted marker genes TIGIT, HAVCR2 (TIM3), CTLA4, and TOX (42, 44). The seventh cluster, which was the CCL4-expressing TRM (CCL4+CD8+ TRM) cluster, expressed high levels of CCL3, CCL4, XCL1, and XCL2. (Figure 3, B and D, Supplemental Figure 2, B and C, and Supplemental Table 3). For subsequent CD8+ TRM subset analysis, we did not focus on the CCL4+CD8+ TRM subset, because the CCL4+CD8+ TRM subset was mainly present in untransplanted HCs, but little in patients with or without intestinal aGVHD (Figure 2E). Compared with the other subsets, the GZMK+CD8+ TRM subset was the highest proportion subset and specifically expressed higher levels of ITGA1 (CD49A) and GZMK (Figure 3E and Supplemental Figure 2D). Based on its marker genes, we identified the GZMK+CD8+ TRM subset as CD8+GZMK+CD49A+, and the GZMK+CD8+ TRM subset demonstrated expression of tissue retention molecule CD69 but little CD103, TCF1, CCR7, and CD62L (Figure 4A, Supplemental Figure 2, E and F, and Supplemental Table 4). We further performed mIHC on intestinal biopsy samples from 65 patients after allo-HSCT (50 patients with intestinal aGVHD and 15 without intestinal aGVHD) and 12 HCs. Compared with those in the HCs and patients without intestinal aGVHD, the mIHC findings in intestinal aGVHD patients revealed greater numbers and ratios of GZMK+CD8+ TRM subset infiltration (P < 0.01 and P < 0.001; Figure 4B). The numbers and ratios of GZMK+CD8+ TRM subset infiltration were also significantly increased in steroid refractory groups (Supplemental Figure 2G). Multivariable binary logistic regression analysis further showed that the number of GZMK+CD8+ TRM cells was associated with the diagnosis of intestinal aGVHD (Table 2). Our analysis revealed that intestinal aGVHD is associated with infiltration of the intestine with GZMK+CD8+ T cells with TRM features.
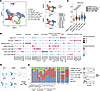 Figure 3
Single-cell analysis identifies distinct CD8+ TRM subsets in the human intestine. (A) Left: UMAP plot of 9,990 CD8+ TRM cells from 3 HCs, 4 patients without aGVHD, and 7 with intestinal aGVHD, which shows 7 CD8+ cell subsets according to gene expression. Right: Cells are colored according to 3 groups and 14 samples. (B) Bubble plot showing the relative expression of representative genes associated with distinct features of CD8+ cell subsets. The color of each dot represents the average normalized expression, ranging from high (red) to low (blue), and the size represents the percentage of positive cells for each gene. (C) Violin plot of TRM scores that were calculated for 5 CD8+ TRM cell subsets. ****P < 0.0001 according to the Wilcoxon test. (D) Feature plots showing the density of representative genes in 5 CD8+ cell subsets. (E) Left: Stacked bar plot showing the proportions of CD8+ TRM cell subsets in each sample and merged groups. Right: CD8+ TRM cell subset abundance differences among HCs, no aGVHD, and aGVHD groups. ****P < 0.0001 according to the Wilcoxon test.
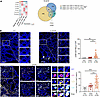 Figure 4
GZMK-expressing CD8+ TRM subset is associated with intestinal aGVHD. (A) Left: Heatmap showing representative gene expression associated with residency features in 4 CD8+ TRM cell subsets. Right: Venn diagram of DEGs that were upregulated in the GZMK+CD8+ TRM subset compared with the TRM-like CD8+ Trecir-stem, CX3CR1+CD8+ TRM, and TIGIT+CD8+ TRM subsets. (B) Left: Representative images from intestinal samples subjected to multiplex immunohistochemical (mIHC) staining for CD8, CD49A, and GZMK, as well as DAPI. The white box indicates CD8+CD49A+GZMK+ TRM subset cells. Right panels highlight co-detection in individual cells. Scale bars: 200 μm and 50 μm (zoomed-in images). Right: Distribution of the GZMK+CD8+ TRM subset in HCs (n = 12), no aGVHD (n = 15), and patients with intestinal aGVHD (n = 50). **P < 0.01; ***P < 0.001; ****P < 0.0001 according to the Wilcoxon test.
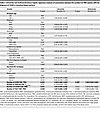 Table 2
Univariate and multivariate binary logistic regression analyses of associations between the numbers of TRM subsets with the diagnosis of GVHD in intestinal biopsy sections
GZMK+CD8+ TRM subset exhibits enhanced clonal expansion and IFN signaling pathway–associated proinflammatory properties in intestinal aGVHD. We mapped the TCR clone information to UMAP to visualize the clone size and distribution across CD8+ TRM subsets (Figure 5A). The CD8+ TRM subsets exhibited a diverse TCR repertoire, ranging from moderately clonally expanded (n = 2) to highly clonally expanded (n ≥ 3). Expanded clones showed a nonuniform distribution of CD8+ TRM subsets (Supplemental Figure 3A). Furthermore, the GZMK+CD8+ TRM subset exhibited enhanced clonal expansion (Figure 5B and Supplemental Figure 3B). We further explored the function of the different CD8+ TRM subsets. GSEA of enriched pathways revealed that the upregulated DEGs in the GZMK+CD8+ TRM subset were associated with GVHD, the IFN-γ response, and antigen processing/presentation signaling pathways compared with other CD8+ TRM subsets (Figure 5C and Supplemental Figure 3C). Moreover, the GZMK+CD8+ TRM subset exhibited the highest oxidative phosphorylation (OXPHOS) score and was highly enriched in ATP-related pathways (Figure 5D and Supplemental Figure 3D). The transcriptional regulatory network that was inferred by SCENIC based on scRNA-seq data confirmed that the transcription factor activities of STAT1 and IRF1 were greater in the GZMK+CD8+ TRM subset. Based on the regulon specificity score (RSS), STAT1 and IRF1 were identified as being the most specific regulons in the GZMK+CD8+ TRM subset (Figure 6A). We compared the atlas-wide similarity of activity scores for every regulon pair using the Connection Specificity Index (CSI). The results demonstrated that STAT1 and IRF1 are localized in one common major module, thus suggesting that they specifically coregulate the GZMK+CD8+ TRM subset (Supplemental Figure 3E). In addition, the transcriptomic expression levels of STAT1, IRF1, and downstream ISG-related genes (such as ISG20, which are enriched in the IFN signaling pathway) were increased (Figure 6B and Supplemental Figure 2B). Compared with HCs and patients without intestinal aGVHD, p-STAT1, IRF1, and ISG20 were significantly upregulated in the GZMK+CD8+ TRM subset of intestinal aGVHD patients according to mIHC (P < 0.05; Figure 3F). Additionally, GZMK+CD8+ TRM cells from aGVHD patients secreted more IFN-γ (P < 0.05; Figure 6C). Our findings indicate that GZMK+CD8+ TRM cells are associated with intestinal aGVHD and display enhanced clonal expansion and IFN signaling–associated proinflammatory pathway expression.
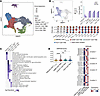 Figure 5
GZMK+CD8+ TRM subset shows enhanced clonal expansion and upregulated proinflammatory pathway expression in intestinal aGVHD. (A) UMAP embedding of the scRNA-seq data of T cells that were mapped to TCR clone information, color-coded according to CD8+ TRM cell subsets. Clonal expansion, which was defined by a shared CDR3 nucleotide sequence and V and J gene usage, is depicted according to marker size. (B) Top: UMAP and bar plot showing percentage of TRM-like CD8+ Trecir-stem, GZMK+CD8+ TRM, CX3CR1+CD8+ TRM, and TIGIT+CD8+ TRM subsets stratified according to clone size. Bottom: Pie charts showing the CD8+ TRM cell subset composition of the clones of each sample, stratified according to clone size in individual samples. (C) GSEA of enriched pathways (KEGG and HALLMARK) for 4 CD8+ TRM cell subsets (P value < 0.05). (D) Violin plot of enrichment scores (left) and heatmap of representative genes for the oxidative phosphorylation (OXPHOS) signature in 4 CD8+ TRM cell subsets (right). **P < 0.01; ****P < 0.0001 according to the Wilcoxon test.
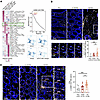 Figure 6
GZMK+CD8+ TRM cells upregulated STAT1/IRF1-related inflammatory signaling in intestinal aGVHD. (A) Left: Heatmap showing the top 10 scaled transcription factor activities in 4 CD8+ TRM cell subsets, as calculated by SCENIC analysis. Right: Specificity of regulons in GZMK+CD8+ TRM cells based on the regulon specificity score (RSS). The colors indicate the most specific IRF1 and STAT1 regulons. (B) Left: Representative mIHC staining images of CD8, CD49A, GZMK, p-STAT1, IRF1, and ISG20, as well as DAPI. Right: Proportions of p-STAT1, IRF1, and ISG20 coexpressed in the GZMK+CD8+ TRM cell subset (HCs, n = 9; no aGVHD, n = 12; aGVHD, n = 36). (C) Left: Representative mIHC staining images of CD8, CD49A, GZMK, IFN-γ, as well as DAPI. Right: Proportions of IFN-γ in the CD8+GZMK+ TRM cell subset (HCs, n = 9; no aGVHD, n = 12; aGVHD, n = 36). Scale bars: 100 μm and 20 μm (zoomed-in images). *P < 0.05; ***P < 0.001 according to the Wilcoxon test.
GZMK+CD8+ TRM subset displayed lineage bifurcation differentiation properties and differentiated more into an effector-like CD8+ TRM subset in intestinal aGVHD. After scoring for stemness, effector, and exhausted signatures (32, 43, 46), the TRM-like CD8+ Trecir-stem, CX3CR1+CD8+ TRM, and TIGIT+CD8+ TRM subsets displayed significant expression of stemness, effector, and exhausted gene signatures, respectively. The GZMK+CD8+ TRM subset exhibited moderate expression of both effector and exhausted gene signatures and a low expression of the stemness gene signature, thus suggesting that this subset has features of transition (P < 0.0001; Figure 7A). To infer potential differentiation relationships, we observed 2 distinct CD8+ TRM subset pseudotime trajectories using Slingshot (47), PAGA (48), and Monocle3 (49) (Figure 7B and Supplemental Figure 4, A and B). The TRM-like CD8+ Trecir-stem cluster had the highest TCR richness, which we considered to be the root of the trajectories (Figure 7C). The TRM-like CD8+ Trecir-stem cluster differentiated into the GZMK+CD8+ TRM cluster. The GZMK+CD8+ TRM cluster, referred to as transition-like TRM (TRMtrans), branched into 2 different trajectories to form the CX3CR1+CD8+ TRM (effector-like TRM, TRMeff) and TIGIT+CD8+ TRM (exhausted-like TRM, TRMexh) clusters. The decrease in TCR richness along the trajectories further confirmed the differentiation trajectories (Figure 7C). Contiguous CD8+ TRM subsets within the trajectories shared TCR clonotypes, and the TRMtrans cluster was able to differentiate into both TRMeff and TRMexh clusters (Figure 7D and Supplemental Figure 4C), which further supported the plausibility of these inferred trajectories. The DEGs and gene signature enrichment scores along 2 pseudotime trajectories demonstrated that the functions of different CD8+ TRM cell subsets are diverse. Along 2 pseudotime trajectories, stemness-related genes (TCF7, LEF1, and CCR7) were downregulated, whereas effector-related (KLRG1 and FGFBP2) and exhausted-related genes (CTLA4 and TOX) were upregulated, in the TRMeff and TRMexh trajectories, respectively (32, 43). As previously reported, ZEB2 and PTPN6 (SHP-1) were upregulated in the TRMeff and TRMexh trajectories, respectively, further indicating that CD8+ TRM differentiation is related to TCR affinity and signal strength (42). In addition, the NK cell receptor genes SLAMF7 and KLRD1 were upregulated in the TRMeff trajectories, and ENTPD1 and IKZF2 were upregulated in the TRMexh trajectories. In the TRMtrans cluster, the antigen presentation–related marker CD74, the T cell activation–related marker CD38, and HLA-DRA were upregulated at early time points and remained the most highly expressed genes in the TRMeff trajectory. The GZMK expression levels were maximal in the TRMtrans cluster and progressively decreased during the TRMeff and TRMexh trajectories (Figure 7E and Supplemental Figure 4D). Visualization of the combination of transcriptional cell states with their clonal frequency for CD8+ TRM subsets revealed that the TRMtrans cluster exhibited a high degree of cell state sharing (Figure 8A). Furthermore, the UpSet plot revealed that 80% of the expanded clones in the TRMtrans cluster lacked TRM-like CD8+ Trecir-stem counterparts (Figure 8B). To understand whether the observed clonal expansion in the TRMtrans subset could be due to the TCR signal, we demonstrated that TCR signaling pathway scores were highest in the TRMtrans subset (Figure 8C). Based on the DEGs among the CD8+ TRM subsets, we further identified the TRM-like CD8+ Trecir-stem subset as CD8+CD69+TCF1(TCF7)+, the TRMeff subset as CD8+CD18(ITGB2)+CX3CR1+, and the TRMexh subset as CD8+CD103(ITGAE)+TIGIT+. Our mIHC staining results showed that there was a lower tendency for infiltration of the TRM-like CD8+ Trecir-stem subset in intestinal aGVHD patients (Figure 9A). Although the TRMeff and TRMexh subset infiltration increased, it was not significantly increased compared with TRMtrans subset infiltration (P = 0.04 and P = 0.02; Figure 9A). We subsequently compared the spatial distances among the CD8+ TRM subsets. We found that the TRMtrans subset in aGVHD patients exhibited a greater proximity to the TRMeff compared with the TRMexh subset (P < 0.05; Figure 9B). Transition index analysis also further suggested that the TRMtrans subset differentiated more into a TRMeff subset in intestinal aGVHD (Figure 9B). Our findings indicated that the GZMK+CD8+ TRM subset displayed lineage bifurcation differentiation properties and differentiated more into a CD8+ TRMeff subset in intestinal aGVHD.
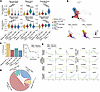 Figure 7
GZMK+CD8+ TRM cells display lineage bifurcation differentiation properties. (A) Violin plot of enrichment scores for the stemness, effector, and exhausted signatures in 4 CD8+ TRM cell subsets. ****P < 0.0001 according to the Wilcoxon test. (B) Pseudotime trajectories for CD8+ TRM cell subsets based on Slingshot, which show 2 trajectories (effector-like TRM [TRMeff] and exhausted-like TRM [TRMexh]), color-coded for CD8+ TRM cell subsets (left) and pseudotime (right). (C) Left: TCR richness for CD8+ TRM cell subsets. Right: Clonotype richness along the CD8+ TRMeff and CD8+ TRMexh trajectories. (D) Chord diagram of shared TCR clones for the 4 CD8+ TRM cell subsets. (E) Plot of markers and functional genes along the CD8+ TRM cell trajectories.
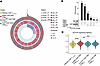 Figure 8
GZMK+CD8+ TRM cells show clonal sharing and enhanced TCR signaling. (A) Circos plot of combined TCR sequencing and transcriptomic data. The outer ring (gray bar graphs) indicates the TCR frequency (1 bar per clonotype). The second ring is colored by the CD8+ TRM cell subset. The third ring is colored by the individual intestinal samples. The inner ring is colored by the clone size. (B) UpSet plot showing the degree of shared TCR clones among CD8+ TRM cell subsets. (C) Violin plot of enrichment scores for the TCR signaling pathway signature (GO) in 4 CD8+ TRM cell subsets. **P < 0.01; ***P < 0.001; ****P < 0.0001 according to the Wilcoxon test.
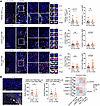 Figure 9
Spatial analysis shows preferential differentiation of GZMK+CD8+ TRM cells toward effector-like TRM cells in intestinal aGVHD. (A) Left: Representative multiplex immunohistochemical (mIHC) staining images for CD8, CD69, TCF1, CD18, CX3CR1, CD103, and TIGIT, as well as DAPI of the intestinal samples. The white boxes indicate TRM-like CD8+ Trecir-stem, TRMeff, and TRMexh subsets. Scale bars: 200 μm and 50 μm (zoomed-in images). Right: Percentages and numbers of the TRM-like CD8+ Trecir-stem, TRMeff, and TRMexh subsets (no aGVHD, n = 15; aGVHD, n = 50). (B) Left: Representative mIHC staining images for CD8, CD49A, GZMK, CD18, CX3CR1, CD103, and TIGIT, as well as DAPI of intestinal samples. Spatial distances between different CD8+ TRM subsets. Scale bar: 200 μm. Right: Heatmap of transition index in the different CD8+ TRM cell subsets (no aGVHD, n = 12; aGVHD, n = 36). *P < 0.05 according to Student’s t test.
High infiltration of the GZMK+CD8+ TRM subset correlates with the severity of intestinal aGVHD and predicts the outcome of patients with intestinal aGVHD. We further explored whether high infiltration of the GZMK+CD8+ TRM subset was associated with intestinal aGVHD severity. We grouped the intestinal aGVHD samples into mild/moderate (stages 1–2) and severe (stages 3–4) according to modified Glucksberg criteria (50) and compared the frequency distributions of TRM subsets between the 2 groups (Figure 10A). Compared with the mild/moderate aGVHD group, the frequency of the GZMK+CD8+ TRM subset was greater in the severe aGVHD group (Figure 10B). Moreover, the GZMK+CD8+ TRM subset in the severe aGVHD group was highly clonally expanded (Figure 10C). Compared with 12 mild/moderate aGVHD patients, a significant increase in the GZMK+CD8+ TRM subset of 38 severe aGVHD patients was detected via mIHC (P < 0.05 and P < 0.01; Figure 10D). Moreover, GZMK+CD8+ TRM subset infiltration decreased as aGVHD improved after treatment (Figure 11A). In contrast, the infiltration of the CX3CR1+ TRMeff subset showed a decreasing trend, while TRM-like CD8+ Trecir-stem and TIGIT+ TRMexh subsets did not change significantly after treatment (Figure 11A). Survival analysis demonstrated that high GZMK+CD8+ TRM subset infiltration was associated with worse overall survival (OS) and disease-free survival (DFS) (P < 0.01 and P < 0.05; Figure 11B). However, CX3CR1+ TRMeff and TIGIT+ TRMexh infiltration was not associated with survival and prognosis (Figure 11B). Multivariable analysis of risk factors for OS and DFS further showed that absolute cell number of the GZMK+CD8+ TRM subset was a risk factor for OS, whereas no risk factors were identified for DFS (Table 3). Our data indicate that a higher absolute number of infiltrating GZMK+CD8+ TRM cells at the time of biopsy was associated with lower subsequent survival.
 Figure 10
GZMK+CD8+ TRM cell infiltration correlates with intestinal aGVHD severity. (A) UMAP plot of intestinal CD8+ TRM cells from mild/moderate (stages 1–2) (582 cells) and severe (stages 3–4) (3,914 cells) intestinal aGVHD patients. (B) Stacked bar plot of CD8+ TRM subset cells in mild/moderate and severe intestinal aGVHD patients. (C) Quantification of clone size for CD8+ TRM subset cells in mild/moderate and severe intestinal aGVHD patients. (D) Representative images (left) and quantification (right) of GZMK+CD8+ TRM subset cells according to GVHD severity. Percentages and numbers of the GZMK+CD8+ TRM subset cells in mild/moderate (n = 12) and severe (n = 38) intestinal aGVHD patients. Scale bars: 100 μm. *P < 0.05; **P < 0.01 according to Student’s t test.
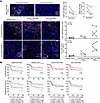 Figure 11
GZMK+CD8+ TRM cell infiltration decreases after remission and predicts poor survival. (A) Left: Representative images of GZMK+CD8+ TRM cells from one patient after remission (remission from stage 3 to stage 1). Scale bars: 100 μm. Right: The changes in the numbers and percentages of GZMK+CD8+ TRM, TRM-like CD8+ Trecir-stem, TRMeff, and TRMexh subset cells during the remission process (n = 3). (B) Overall survival (OS) and disease-free survival (DFS) are associated with the absolute number of infiltrating of GZMK+CD8+ TRM, TRM-like CD8+ Trecir-stem, TRMeff, and TRMexh subset cells at the time of biopsy in intestinal aGVHD patients, as assessed via mIHC. *P < 0.05; **P < 0.01 according to the 2-sided log-rank (Mantel-Cox) test.
Donor-derived GZMK+CD8+ TRM cell deficiency attenuates intestinal aGVHD severity. To confirm the role of donor-derived GZMK+CD8+ TRM cells in intestinal aGVHD, BALB/c recipients were injected with 2.5 × 10⁶ T cell–depleted bone marrow cells (TCD-BM) from wild-type (WT) C57BL/6 donors alone or together with sorted CD4+ T cells (0.25 × 10⁶) from WT C57BL/6 donor spleen and sorted CD8+ T cells (2.5 × 10⁶) from WT C57BL/6 or Gzmk–/– C57BL/6 donor spleen (Figure 12A). Recipients given TCD-BM from WT C57BL/6 donors showed no signs of aGVHD and were used as TCD-BM-no-aGVHD recipients. Recipients given sorted CD4+ T cells and CD8+ T cells from WT C57BL/6 donor spleen developed overt aGVHD with body weight loss, clinical signs, and mortality, and 0% survived for more than 21 days and were described as WT-aGVHD recipients (Figure 12, B–D). In contrast, recipients given sorted CD4+ T cells (WT C57BL/6) and sorted CD8+ T cells from Gzmk–/– C57BL/6 donor spleen developed mild aGVHD with fewer clinical signs and less body weight loss, and approximately 40% survived beyond 21 days and were described as Gzmk–/–-mild-aGVHD recipients (Figure 12, B–E). Compared with TCD-BM-no-aGVHD recipients, WT-aGVHD recipients showed typical histopathology of aGVHD, including (a) lymphocytic infiltration, epithelial cell apoptosis, and crypt dropout; (b) epidermal hyperplasia, expansion of dermis, and loss of subcutaneous fat; (c) lymphocytic infiltration in hepatic portal triads; and (d) lymphocytic bronchiolitis. Gzmk–/–-mild-aGVHD recipients showed less tissue damage on day 14 after hematopoietic cell transplantation (HCT) (Figure 13A). As compared with control TCD-BM-no-aGVHD recipients, WT-aGVHD recipients had a marked increase of GZMK+CD8+ TRM cell infiltration in the intestines by multiplex immunofluorescence analysis. In contrast, almost no GZMK+CD8+ TRM cell infiltration in the intestines was observed in the Gzmk–/–-mild-aGVHD recipients (Figure 14A). Our data indicate that donor-derived GZMK+CD8+ TRM cell deficiency attenuates intestinal aGVHD severity.
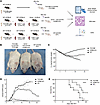 Figure 12
Donor-derived GZMK+CD8+ TRM cell deficiency attenuates intestinal aGVHD severity. Lethally irradiated BALB/c recipients transplanted with 2.5 × 10⁶ T cell–depleted bone marrow cells (TCD-BM) from WT C57BL/6 donors alone or together with sorted CD4+ T cells (0.25 × 10⁶) from WT C57BL/6 donor spleen and sorted CD8+ T cells (2.5 × 10⁶) from WT C57BL/6 or Gzmk–/– C57BL/6 donor spleen. Recipients were monitored for GVHD development, including body weight change, clinical aGVHD scores, and survival. (A) The diagram of the experimental design. (B) A representative photograph taken at day 14 is shown. (C–E) Body weight change, clinical aGVHD scores, and survival percentage († indicates death of all recipients in a group); n = 8 recipients from 2 replicate experiments. ****P < 0.0001 according to the 2-sided log-rank (Mantel-Cox) test.
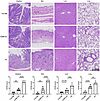 Figure 13
GZMK deficiency alleviates target-organ pathological injury in murine aGVHD. On day 14 after HCT, histopathology of the aGVHD target tissues intestine, skin, liver, and lung was evaluated. A representative photomicrograph (scale bar: 200 μm) and mean ± SEM (n = 6) of histopathology scores are shown. **P < 0.01; ***P < 0.001; ****P < 0.0001 according to the Wilcoxon test.
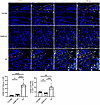 Figure 14
GZMK deficiency reduces intestinal GZMK+CD8+ TRM cell infiltration in murine aGVHD. (A) Representative mIHC staining images for CD8, CD49A, and GZMK, as well as DAPI of intestinal samples. Scale bar: 100 μm. Percentages and numbers of the GZMK+CD8+ TRM subset in the TCD-BM, GZMK-KO, and WT groups (n = 6). **P < 0.01; ***P < 0.001; ****P < 0.0001 according to the Wilcoxon test.


