
Research ArticleCell biologyOphthalmology
Open Access |  10.1172/jci.insight.194102
Restoration of impaired lysosomal function mitigates drusen-like deposit formation and cell death in Malattia Leventinese
Yumi Inoue,1 Hanako O. Ikeda,1,2 Masayuki Hata,1 Yuto Iida,1 Keiko Okamoto-Furuta,3 Isao Asaka,4 Makoto Arita,5,6 and Akitaka Tsujikawa1
1Department of Ophthalmology and Visual Sciences, Kyoto University Graduate School of Medicine, Sakyo-ku, Kyoto, Japan.
2Department of Ophthalmology, Osaka Medical and Pharmaceutical University, Takatsuki, Osaka, Japan.
3Division of Electron Microscopic Study, Center for Anatomical Studies, Kyoto University Graduate School of Medicine, Sakyo-ku, Kyoto, Japan.
4Department of Fundamental Cell Technology, Center for iPS Cell Research and Application (CiRA), Kyoto University, Sakyo-ku, Kyoto, Japan.
5Laboratory for Metabolomics, RIKEN Center for Integrative Medical Sciences, Yokohama, Kanagawa, Japan.
6Division of Physiological Chemistry and Metabolism, Graduate School of Pharmaceutical Sciences, Keio University, Minato-ku, Tokyo, Japan.
Address correspondence to: Hanako Ohashi Ikeda, Department of Ophthalmology and Visual Sciences, Kyoto University Graduate School of Medicine, Sakyo-ku, Kyoto 606-8507, Japan. Phone: 81.75.751.3248; Email: hanakoi@kuhp.kyoto-u.ac.jp.
Find articles by Inoue, Y. in: PubMed | Google Scholar
1Department of Ophthalmology and Visual Sciences, Kyoto University Graduate School of Medicine, Sakyo-ku, Kyoto, Japan.
2Department of Ophthalmology, Osaka Medical and Pharmaceutical University, Takatsuki, Osaka, Japan.
3Division of Electron Microscopic Study, Center for Anatomical Studies, Kyoto University Graduate School of Medicine, Sakyo-ku, Kyoto, Japan.
4Department of Fundamental Cell Technology, Center for iPS Cell Research and Application (CiRA), Kyoto University, Sakyo-ku, Kyoto, Japan.
5Laboratory for Metabolomics, RIKEN Center for Integrative Medical Sciences, Yokohama, Kanagawa, Japan.
6Division of Physiological Chemistry and Metabolism, Graduate School of Pharmaceutical Sciences, Keio University, Minato-ku, Tokyo, Japan.
Address correspondence to: Hanako Ohashi Ikeda, Department of Ophthalmology and Visual Sciences, Kyoto University Graduate School of Medicine, Sakyo-ku, Kyoto 606-8507, Japan. Phone: 81.75.751.3248; Email: hanakoi@kuhp.kyoto-u.ac.jp.
Find articles by Ikeda, H. in: PubMed | Google Scholar
1Department of Ophthalmology and Visual Sciences, Kyoto University Graduate School of Medicine, Sakyo-ku, Kyoto, Japan.
2Department of Ophthalmology, Osaka Medical and Pharmaceutical University, Takatsuki, Osaka, Japan.
3Division of Electron Microscopic Study, Center for Anatomical Studies, Kyoto University Graduate School of Medicine, Sakyo-ku, Kyoto, Japan.
4Department of Fundamental Cell Technology, Center for iPS Cell Research and Application (CiRA), Kyoto University, Sakyo-ku, Kyoto, Japan.
5Laboratory for Metabolomics, RIKEN Center for Integrative Medical Sciences, Yokohama, Kanagawa, Japan.
6Division of Physiological Chemistry and Metabolism, Graduate School of Pharmaceutical Sciences, Keio University, Minato-ku, Tokyo, Japan.
Address correspondence to: Hanako Ohashi Ikeda, Department of Ophthalmology and Visual Sciences, Kyoto University Graduate School of Medicine, Sakyo-ku, Kyoto 606-8507, Japan. Phone: 81.75.751.3248; Email: hanakoi@kuhp.kyoto-u.ac.jp.
Find articles by Hata, M. in: PubMed | Google Scholar
1Department of Ophthalmology and Visual Sciences, Kyoto University Graduate School of Medicine, Sakyo-ku, Kyoto, Japan.
2Department of Ophthalmology, Osaka Medical and Pharmaceutical University, Takatsuki, Osaka, Japan.
3Division of Electron Microscopic Study, Center for Anatomical Studies, Kyoto University Graduate School of Medicine, Sakyo-ku, Kyoto, Japan.
4Department of Fundamental Cell Technology, Center for iPS Cell Research and Application (CiRA), Kyoto University, Sakyo-ku, Kyoto, Japan.
5Laboratory for Metabolomics, RIKEN Center for Integrative Medical Sciences, Yokohama, Kanagawa, Japan.
6Division of Physiological Chemistry and Metabolism, Graduate School of Pharmaceutical Sciences, Keio University, Minato-ku, Tokyo, Japan.
Address correspondence to: Hanako Ohashi Ikeda, Department of Ophthalmology and Visual Sciences, Kyoto University Graduate School of Medicine, Sakyo-ku, Kyoto 606-8507, Japan. Phone: 81.75.751.3248; Email: hanakoi@kuhp.kyoto-u.ac.jp.
Find articles by
Iida, Y.
in:
PubMed
|
Google Scholar
|

1Department of Ophthalmology and Visual Sciences, Kyoto University Graduate School of Medicine, Sakyo-ku, Kyoto, Japan.
2Department of Ophthalmology, Osaka Medical and Pharmaceutical University, Takatsuki, Osaka, Japan.
3Division of Electron Microscopic Study, Center for Anatomical Studies, Kyoto University Graduate School of Medicine, Sakyo-ku, Kyoto, Japan.
4Department of Fundamental Cell Technology, Center for iPS Cell Research and Application (CiRA), Kyoto University, Sakyo-ku, Kyoto, Japan.
5Laboratory for Metabolomics, RIKEN Center for Integrative Medical Sciences, Yokohama, Kanagawa, Japan.
6Division of Physiological Chemistry and Metabolism, Graduate School of Pharmaceutical Sciences, Keio University, Minato-ku, Tokyo, Japan.
Address correspondence to: Hanako Ohashi Ikeda, Department of Ophthalmology and Visual Sciences, Kyoto University Graduate School of Medicine, Sakyo-ku, Kyoto 606-8507, Japan. Phone: 81.75.751.3248; Email: hanakoi@kuhp.kyoto-u.ac.jp.
Find articles by Okamoto-Furuta, K. in: PubMed | Google Scholar
1Department of Ophthalmology and Visual Sciences, Kyoto University Graduate School of Medicine, Sakyo-ku, Kyoto, Japan.
2Department of Ophthalmology, Osaka Medical and Pharmaceutical University, Takatsuki, Osaka, Japan.
3Division of Electron Microscopic Study, Center for Anatomical Studies, Kyoto University Graduate School of Medicine, Sakyo-ku, Kyoto, Japan.
4Department of Fundamental Cell Technology, Center for iPS Cell Research and Application (CiRA), Kyoto University, Sakyo-ku, Kyoto, Japan.
5Laboratory for Metabolomics, RIKEN Center for Integrative Medical Sciences, Yokohama, Kanagawa, Japan.
6Division of Physiological Chemistry and Metabolism, Graduate School of Pharmaceutical Sciences, Keio University, Minato-ku, Tokyo, Japan.
Address correspondence to: Hanako Ohashi Ikeda, Department of Ophthalmology and Visual Sciences, Kyoto University Graduate School of Medicine, Sakyo-ku, Kyoto 606-8507, Japan. Phone: 81.75.751.3248; Email: hanakoi@kuhp.kyoto-u.ac.jp.
Find articles by Asaka, I. in: PubMed | Google Scholar
1Department of Ophthalmology and Visual Sciences, Kyoto University Graduate School of Medicine, Sakyo-ku, Kyoto, Japan.
2Department of Ophthalmology, Osaka Medical and Pharmaceutical University, Takatsuki, Osaka, Japan.
3Division of Electron Microscopic Study, Center for Anatomical Studies, Kyoto University Graduate School of Medicine, Sakyo-ku, Kyoto, Japan.
4Department of Fundamental Cell Technology, Center for iPS Cell Research and Application (CiRA), Kyoto University, Sakyo-ku, Kyoto, Japan.
5Laboratory for Metabolomics, RIKEN Center for Integrative Medical Sciences, Yokohama, Kanagawa, Japan.
6Division of Physiological Chemistry and Metabolism, Graduate School of Pharmaceutical Sciences, Keio University, Minato-ku, Tokyo, Japan.
Address correspondence to: Hanako Ohashi Ikeda, Department of Ophthalmology and Visual Sciences, Kyoto University Graduate School of Medicine, Sakyo-ku, Kyoto 606-8507, Japan. Phone: 81.75.751.3248; Email: hanakoi@kuhp.kyoto-u.ac.jp.
Find articles by
Arita, M.
in:
PubMed
|
Google Scholar
|
1Department of Ophthalmology and Visual Sciences, Kyoto University Graduate School of Medicine, Sakyo-ku, Kyoto, Japan.
2Department of Ophthalmology, Osaka Medical and Pharmaceutical University, Takatsuki, Osaka, Japan.
3Division of Electron Microscopic Study, Center for Anatomical Studies, Kyoto University Graduate School of Medicine, Sakyo-ku, Kyoto, Japan.
4Department of Fundamental Cell Technology, Center for iPS Cell Research and Application (CiRA), Kyoto University, Sakyo-ku, Kyoto, Japan.
5Laboratory for Metabolomics, RIKEN Center for Integrative Medical Sciences, Yokohama, Kanagawa, Japan.
6Division of Physiological Chemistry and Metabolism, Graduate School of Pharmaceutical Sciences, Keio University, Minato-ku, Tokyo, Japan.
Address correspondence to: Hanako Ohashi Ikeda, Department of Ophthalmology and Visual Sciences, Kyoto University Graduate School of Medicine, Sakyo-ku, Kyoto 606-8507, Japan. Phone: 81.75.751.3248; Email: hanakoi@kuhp.kyoto-u.ac.jp.
Find articles by Tsujikawa, A. in: PubMed | Google Scholar
Published July 22, 2026 - More info
JCI Insight. 2026;11(14):e194102. https://doi.org/10.1172/jci.insight.194102.
© 2026 Inoue et al. This work is licensed under the Creative Commons Attribution 4.0 International License. To view a copy of this license, visit http://creativecommons.org/licenses/by/4.0/.
Received: April 11, 2025; Accepted: May 19, 2026


-
Results
Generation of MAL patient–specific iPSCs and iPSC-derived RPE. We established iPSC lines from a patient with MAL (MAL1 and MAL2) and 2 healthy individuals (NOR1 and NOR2), and we then differentiated them into iPSC-RPE cells. The differentiated iPSC-RPE cells exhibited polygonal, cobblestone-like morphology and were cultured until they developed high pigmentation, indicating full functional maturity. Immunocytochemical staining showed strong expression of tight junction protein 1 (ZO-1), a tight junction marker, in both NOR and MAL iPSC-RPE cells (Figure 1A). To further assess epithelial junctional integrity and apical polarity, we performed immunostaining for claudin-16 and claudin-19, tight junction–associated claudins expressed in RPE (15). The results indicated continuous junctional localization with comparable staining patterns in NOR and MAL iPSC-RPE cells (Figure 1B and Supplemental Figure 1; supplemental material available online with this article; https://doi.org/10.1172/jci.insight.194102DS1). In addition, phosphorylated ezrin/radixin/moesin (pERM), the active phosphorylated form of ERM proteins involved in apical membrane organization (16), exhibited similar apical localization in both NOR and MAL iPSC-RPE cells (Figure 1C), supporting preserved apical polarity.
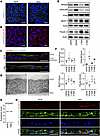 Figure 1
Altered fibulin-3 distribution in MAL iPSC-RPE. Induced pluripotent stem cell–derived retinal pigment epithelial (iPSC-RPE) cells were cultured for 4 weeks to ensure adequate differentiation. (A and B) Immunostaining of normal (NOR) and Malattia Leventinese (MAL) iPSC-RPE cells for tight junction protein 1 (ZO-1, green, A) and claudin-16 (red, B), counterstained with DAPI (blue). (C) Immunostaining of the cross-sections of iPSC-RPE for phosphorylated ezrin/radixin/moesin (pERM, red), phalloidin (green), and DAPI (blue). (D) Transmission electron microscopy images of NOR and MAL iPSC-RPE cells in vertical cross-sections. (E and F) Western blot analysis of retinal pigment epithelium-specific 65 kDa protein (RPE65), retinaldehyde binding protein 1 (CRALBP), bestrophin-1 (BEST1), and fibulin-3 in NOR and MAL iPSC-RPE cells. Data are shown as mean ± SD, n = 5 biological replicates. (G) Expression levels of the EGF-like fibulin extracellular matrix protein 1 (EFEMP1) gene in NOR and MAL iPSC-RPE cells were analyzed by RNA-seq. The y axis represents expression levels in log2 TPM (transcripts per million). (H) Immunostaining of the cross-sections of iPSC-RPE for fibulin-3 (red), phalloidin (green), and DAPI (blue). Scale bar: 20 μm (A, B, C, and H); 2 μm (D).
Transmission electron microscopy (TEM) confirmed that NOR and MAL iPSC-RPE cells formed monolayers of highly polarized cells with apical microvilli and melanosomes (Figure 1D). Key RPE biomarkers, including RPE-specific 65 kDa protein (RPE65), retinaldehyde binding protein 1 (CRALBP), and bestrophin-1 (BEST1), were detected in both NOR and MAL iPSC-RPE cells (Figure 1, E and F). Although EFEMP1 RNA expression levels were comparable between MAL and NOR iPSC-RPE cells (Figure 1G), fibulin-3 protein levels were higher in MAL iPSC-RPE cells (Figure 1, E and F). Immunostaining further revealed enhanced fibulin-3 immunoreactivity on and beneath the basal side of the MAL iPSC-RPE cells compared with NOR controls (Figure 1H).
Cytotoxicity in MAL iPSC-RPE. Because intracellular accumulation of misfolded proteins can induce cellular stress and apoptosis, we next examined whether MAL iPSC-RPE cells exhibit increased cytotoxicity. RPE cells are highly specialized, postmitotic cells that phagocytose large amounts of photoreceptor outer segments (POS) daily in vivo and play a central role in lipid metabolism and waste clearance. Accordingly, POS were introduced in the following experiments to impose a physiologically relevant phagocytic and lysosomal burden and to better model disease-associated cellular stress conditions in vitro. Immunostaining of iPSC-RPE cross-sections revealed an accumulation of heat shock protein family A (HSP70) member 5 (HSPA5) in the MAL iPSC-RPE cells (Figure 2A). Additionally, cleaved caspase-3, the active form of the enzyme involved in apoptosis, was detected in MAL iPSC-RPE cells (Figure 2, B and C). MAL iPSC-RPE cells revealed a significant increase in TdT-mediated dUTP nick-end labeling+ (TUNEL)+ apoptotic cells (Figure 2, D and E). Furthermore, the expression of growth arrest specific 6 (GAS6) and tyrosine-protein kinase receptor (AXL) — components of the Tyro3/Axl/MerTK (TAM) signaling pathway involved in the phagocytosis of apoptotic cells (17) — was significantly upregulated in MAL iPSC-RPE cells (Figure 2F and Supplemental Figure 2A). These findings indicate that MAL-derived iPSC-RPE cells undergo increased cellular damage and apoptotic cell death.
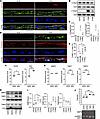 Figure 2
Apoptosis and extracellular matrix degradation in MAL iPSC-RPE cells. iPSC-RPE cells were cultured for 4 weeks, followed by an additional 4 weeks of incubation in the presence or absence of photoreceptor outer segments (POS). (A) Immunostaining of cross-sections of NOR and MAL iPSC-RPE, showing heat shock protein family A (Hsp70) member 5 (HSPA5, red), phalloidin (green), and DAPI (blue). (B and C) Western blot analysis of total and cleaved caspase-3 (t-Casp3 and c-Casp3) in NOR and MAL iPSC-RPE cells treated with POS. (D and E) TdT-mediated dUTP nick-end labeling (TUNEL) staining (green) of cross-sections of NOR and MAL iPSC-RPE cells. (F and G) The expression levels of growth arrest specific 6 (GAS6), tyrosine-protein kinase receptor (AXL), matrix metalloproteinase-2 (MMP2), and metalloproteinase inhibitors 1 and 3 (TIMP1 and TIMP3) in NOR and MAL iPSC-RPE cells were analyzed by RNA-seq. The y axis represents expression levels in log2 transcripts per million (TPM). Corresponding analyses, including both POS (–) and POS (+) conditions, are shown in Supplemental Figure 2. (H and I) Western blot analysis of MMP2, TIMP1, and TIMP3 expression in NOR and MAL iPSC-RPE cells. (J) Measurement of MMP2 activity in medium supernatants of NOR and MAL iPSC-RPE using gelatin zymography. Scale bar: 20 μm (A and D). *P < 0.05, ***P < 0.005. Data in C, E, I, and J were analyzed using a linear mixed-effects model followed by Tukey’s HSD test. Data in F and G were analyzed using Student’s t test; n = 3 (C, F, G, and J), n = 5 (I), n = 10 (E). Data are shown as mean ± SD.
Activation of matrix metalloproteinase in the extracellular milieu of MAL iPSC-RPE. Given the cellular damage observed in MAL iPSC-RPE cells during prolonged culture, and considering that fibulin-3 regulates extracellular matrix homeostasis by modulating matrix metalloproteinases and their inhibitors (10), we focused on MMP2 and its endogenous inhibitors, TIMP1 and TIMP3. Gene expression analysis showed no significant difference in MMP2 levels between NOR and MAL iPSC-RPE cells (Figure 2G and Supplemental Figure 2B). However, the expression of TIMP1 and TIMP3 was significantly reduced in MAL iPSC-RPE cells (Figure 2G). In contrast, Western blot analysis revealed that MMP2 and TIMP1 protein levels were higher in MAL iPSC-RPE cells than in NOR iPSC-RPE cells (Figure 2, H and I), while TIMP3 protein levels remained similar between the 2 groups. Additionally, gelatin zymography of culture supernatants demonstrated that secreted and active MMP2 levels were elevated in MAL iPSC-RPE cells compared with NOR iPSC-RPE cells (Figure 2J). These findings suggest that MMP2 activation in the extracellular milieu of MAL iPSC-RPE cells may contribute to enhanced extracellular matrix degradation, potentially playing a role in disease progression.
Formation of drusen-like deposits beneath MAL iPSC-RPE. Because extracellular matrix dysregulation and impaired waste clearance by RPE are central to drusen formation in AMD and MAL, we next examined whether MAL iPSC-RPE cells form drusen-like deposits. When MAL iPSC-RPE cells were cultured for 4 weeks and subsequently exposed to POS, whitish drusen-like structures began to appear beneath the cells after approximately 3 weeks of POS treatment. POS exposure was associated with a trend toward increased size and prominence of these deposits (Supplemental Figure 3, A and B). To further characterize these structures, we performed immunostaining of both cross-sections and en face preparations of iPSC-RPE cultures. In NOR iPSC-RPE cells, apolipoprotein E (ApoE) was detected mainly as fine punctate signals within the membrane, with little intracellular accumulation, consistent with physiological secretion (Figure 3A). In contrast, MAL iPSC-RPE cells exhibited intracellular accumulation of ApoE in the form of enlarged punctate structures (Figure 3, A and B, and Supplemental Figure 3C), as well as ApoE+ deposits located between the cells and the culture membrane (Figure 3A and Supplemental Figure 3C), distinct from the fine membrane-associated signals seen in NOR cultures. Consistent with these findings, en face immunostaining further demonstrated prominent intracellular ApoE+ puncta in MAL iPSC-RPE cells (Figure 3D). Quantitative analysis confirmed that, compared with NOR controls, MAL iPSC-RPE cells exhibited a significantly higher proportion of cells exhibiting enlarged intracellular ApoE+ puncta, together with increased ApoE immunoreactivity within intracellular regions and in the subcellular space adjacent to the culture membrane (Figure 3C). Further analysis revealed that fibulin-3, complement 3 (C3), and collagen IV immunoreactivity were predominantly associated with the drusen-like structures located in the subcellular space beneath the RPE layers and adjacent to the culture membrane in MAL iPSC-RPE (Figure 3, E–J, and Supplemental Figure 3, D–F). Consistent with these observations, C3+ puncta were significantly more abundant in MAL iPSC-RPE (Figure 3H), and fluorescence intensity measurements revealed significantly higher immunoreactivity for fibulin-3 and collagen IV in MAL iPSC-RPE cells relative to NOR iPSC-RPE cells (Figure 3, F and J). Notably, the gene expression levels of ApoE and C3 were slightly higher in MAL iPSC-RPE than in NOR iPSC-RPE, suggesting that these proteins were likely produced and secreted by RPE cells (Supplemental Figure 3G). Additionally, scattered C5b-9 aggregates were observed (Supplemental Figure 3H).
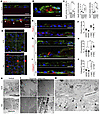 Figure 3
Formation of drusen-like accumulation beneath MAL iPSC-RPE cells. iPSC-RPE cells were cultured for 4 weeks, followed by the addition of POS for an additional 4 weeks. (A–C) Immunostaining of cross-sections of NOR and MAL iPSC-RPE for apolipoprotein E (ApoE, red), phalloidin (green), and DAPI (blue). Arrows highlight intracellular punctate immunoreactivity, while arrowheads denote extracellular deposits beneath the cells. (B) Representative high-magnification image showing punctate ApoE staining in MAL iPSC-RPE cells. (C) Quantification of intracellular ApoE+ puncta-containing cells, intracellular ApoE (ApoE [intra]) fluorescence intensity, and basal ApoE fluorescence intensity in NOR and MAL iPSC-RPE cells. (D) En face image and z stack reconstructions of NOR and MAL iPSC-RPE stained for ApoE (red), phalloidin (green), and DAPI (blue). (E–J) Immunostaining of NOR and MAL iPSC-RPE cross-sections for fibulin-3 (red, E), complement C3 (C3, red, G), or collagen type IV (red, I), along with phalloidin (green) and DAPI (blue). (F, H, and J) Quantification of fibulin-3 (F) and collagen type IV (J); fluorescence intensity and number of C3+ puncta per section (H) in NOR and MAL iPSC-RPE cells. (K and L) Transmission electron microscopy images. (K) Vertical sections of the iPSC-RPE cells. (L) Horizontal section of the basal side (indicated by a white dotted line in the vertical section in K) of iPSC-RPE cells. Arrowheads indicate aggregated fibers. The squares indicate lipid granules. (M) Focused ion beam scanning electron microscopy analysis of drusen-like structures beneath MAL iPSC-RPE cells. Arrowheads indicate lipid granules. A color-coded figure is shown in Supplemental Figure 4. *P < 0.05, **P < 0.01, ***P < 0.005. P values in C, F, H, and J were calculated using a linear mixed-effects model followed by Tukey’s HSD test. n = 10. Scale bars: 20 μm (A, B, D, E, G, and I), 10 μm (M), and 2 μm (K and L).
TEM images of horizontal sections along the basal side — corresponding to the dotted line in the vertical section (Figure 3K) — revealed numerous nonuniform short fibers beneath NOR iPSC-RPE cells. Similar fibers were present in MAL iPSC-RPE cells; however, thick and elongated aggregated fibers were also detected (Figure 3L). Additionally, lipid granules were found beneath MAL iPSC-RPE cells (Figure 3L). To further analyze the drusen-like structures beneath MAL iPSC-RPE cells, we employed focused ion beam scanning electron microscope (FIB-SEM) tomography (Figure 3M and Supplemental Figure 4) and reconstructed a 3D image from serial FIB-SEM section images (Supplemental Videos 1 and 2). The reconstructed images revealed stacked degenerated cells, a widely distributed extracellular matrix on the basal side, and interspersed lipid granules.
These findings suggest that the whitish structures beneath the RPE cells consist of collagen and fibulin-3 fibers. Within these structures, lipid granules, ApoE, and complement components accumulate, resembling drusen observed in patients (4, 18).
Difference in lipid content between NOR and MAL iPSC-RPE. Because lipid accumulation is a major component of drusen and was evident ultrastructurally beneath MAL iPSC-RPE cells, we performed an untargeted lipid analysis to characterize intracellular lipid alterations. The analysis revealed significantly higher levels of hexosylceramide and bis-monoacylglycerophosphate (BMP) in MAL iPSC-RPE cells compared with those in NOR iPSC-RPE cells (Figure 4, A–D). Notably, when comparing NOR and MAL iPSC-RPE cells treated with POS, MAL iPSC-RPE cells exhibited a significant increase in BMP species containing 22:6-22:6 side chains (22 carbon atoms and 6 double bonds in each fatty acyl chain; DHA-DHA) (Figure 4C). Since POS is rich in long-chain fatty acids, particularly 22:6 (19), these findings suggest that phagocytosed POS components accumulate in MAL iPSC-RPE cells. Furthermore, immunostaining of iPSC-RPE cross-sections using an antilysobisphosphatidic acid (LBPA) antibody — LBPA being a specific configuration of BMP — revealed that LBPA formed aggregates and accumulated within MAL iPSC-RPE cells (Figure 4E). The increased expression of phospholipase D family member 3 (PLD3, Figure 4F), the enzyme responsible for BMP synthesis (20) — along with the decreased expression of α/β hydrolase domain containing 6 (ABHD6, Figure 4G), the enzyme responsible for BMP degradation (21) — suggests that these alterations contribute to elevated BMP levels in MAL iPSC-RPE cells.
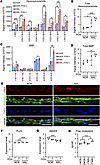 Figure 4
Increased hexosylceramide and bis-monoacylglycerophosphate levels in MAL iPSC-RPE cells revealed by lipidomic analyses. iPSC-RPE cells were cultured for 4 weeks, followed by an additional 4 weeks of incubation in the presence or absence of POS. (A–D) Quantitative analysis of lipid species intensity and total lipid abundance using untargeted liquid chromatography–mass spectrometry and statistical analysis of NOR and MAL iPSC-RPE cells. (A and B) Hexosylceramide. (C and D) Bis-monoacylglycerophosphate (BMP). (E) Immunostaining of cross-sections of NOR and MAL iPSC-RPE cells treated with POS for lysobisphosphatidic acid (LBPA, red), phalloidin (green), and DAPI (blue). Scale bar: 20 μm. (F and G) Expression levels of phospholipase D family member 3 (PLD3, F) and α/β hydrolase domain containing 6 (ABHD6, G). The y axis represents expression levels in log2 TPM (transcripts per million). (H) Comparison of intracellular free cholesterol levels. *P < 0.05, **P < 0.01, ***P < 0.005; 1-way ANOVA followed by the Tukey-Kramer test (A–D, F, and G), a linear mixed-effects model followed by Tukey’s HSD test in (H), n = 3. Data are shown as mean ± SD.
The elevated hexosylceramide levels observed in MAL iPSC-RPE cells suggest a possible connection to the pathophysiology of Gaucher disease, a lysosomal storage disorder characterized by the intracellular accumulation of glucosylceramide, a type of hexosylceramide (22). Given that α-synuclein aggregation is a known feature of Gaucher disease (22), we examined α-synuclein expression in MAL iPSC-RPE cells. While overall α-synuclein expression levels were comparable between NOR and MAL iPSC-RPE cells, immunofluorescence staining revealed α-synuclein aggregation specifically in MAL iPSC-RPE cells (Supplemental Figure 5, A–C). Additionally, we observed a downregulation of carboxylesterase 1 (CES1; Supplemental Figure 5D), an enzyme involved in lipid metabolism, which may impair lipid transport and contribute to intracellular lipid accumulation. However, no significant difference was observed in intracellular free cholesterol levels between NOR and MAL iPSC-RPE cells (Figure 4H).
Decrease and dysfunction of lysosomes in MAL iPSC-RPE. The accumulation of hexosylceramide, BMP, and α-synuclein — molecules normally degraded via lysosomal pathways — prompted us to investigate whether lysosomal biogenesis and function are impaired in MAL iPSC-RPE cells. To assess lysosomal involvement, we analyzed lysosome-related gene expression using RNA-seq. Clustering analysis revealed distinct gene expression patterns between NOR and MAL iPSC-RPE cells, classifying them into separate groups based on their respective conditions (Supplemental Figure 6). Further analysis of the highly expressed gene cluster, designated as “cluster A” in Supplemental Figure 6, revealed significantly lower expression of key lysosomal markers in MAL iPSC-RPE cells compared with NOR iPSC-RPE cells (Figure 5A). Specifically, the expression levels of lysosome-associated membrane protein-2 (LAMP2), cathepsin D (CTSD), and prosaposin (PSAP) were markedly reduced in MAL iPSC-RPE (Figure 5B). These findings suggest impaired lysosomal function in MAL iPSC-RPE, potentially contributing to disease pathology.
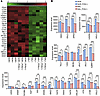 Figure 5
Reduced expression of lysosome-related proteins in MAL iPSC-RPE cells. iPSC-RPE cells were cultured for 4 weeks, followed by an additional 4 weeks of incubation in the presence or absence of POS. RNA-seq analyses were performed on NOR1 and MAL1 in triplicate wells. (A and B) Cluster analysis comparing lysosome-associated gene expression profiles between NOR and MAL iPSC-RPE cells. The cluster showing relatively high expression levels (corresponding to the region highlighted as ‘Cluster A’ in Supplemental Figure 6) was extracted, and the expression levels of individual genes within this cluster are shown in B. Gene expression levels are presented as TPM (1 × 10³) on the y axis. *P < 0.05, **P < 0.01, ***P < 0.005, 1-way ANOVA followed by the Tukey-Kramer test; n = 3 in (B). GGA1, golgi associated, gamma adaptin ear containing, ARF binding protein 1; ARSG, arylsulfatase G; CTSL, cathepsin L; TPP1, tripeptidyl peptidase 1; ABCA2, ATP binding cassette subfamily A member 2; LIPA, lipase A, lysosomal acid type; IDS, iduronate 2-sulfatase; HEXB, hexosaminidase subunit beta; NAGA, α-N-acetylgalactosaminidase, CD68, CD68 molecule; LITAF, lipopolysaccharide-induced TNF factor; CD63, CD63 molecule; ACP2, acid phosphatase 2, lysosomal; GGA2, golgi associated, gamma adaptin ear containing, ARF binding protein 2; ACP5, acid phosphatase 5, tartrate resistant; AP1M1, adaptor related protein complex 1 subunit mu 1; GLA, galactosidase α; ASAH1, N-acylsphingosine amidohydrolase 1; NEU1, neuraminidase 1; CTSO, cathepsin O; CTSH, cathepsin H; CTSF, cathepsin F; CTSD, cathepsin D; LAMP2, lysosomal-associated membrane protein 2; PSAP, prosaposin; TPM, transcripts per million.
Western blot analysis of lysosome-related proteins (Figure 6, A and B) confirmed that CTSD expression in its double-chain forms was lower in MAL iPSC-RPE cells than in NOR iPSC-RPE cells. Similarly, LAMP2 expression was also tended to be reduced in MAL iPSC-RPE cells, although the difference did not reach statistical significance. These findings were further validated by immunostaining of iPSC-RPE cross-sections, which revealed a significant decrease in LAMP2 expression in MAL iPSC-RPE cells (Figure 6, C and D). Consistently, en face confocal imaging demonstrated a punctate intracellular distribution of LAMP2 in NOR iPSC-RPE cells, whereas this punctate lysosomal pattern was markedly reduced in MAL iPSC-RPE cells (Figure 6E). Additionally, TEM imaging shown in Figure 1D suggested a relative reduction in electron-dense vesicular structures consistent with lysosomes in MAL iPSC-RPE cells compared with NOR iPSC-RPE cells.
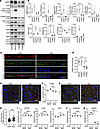 Figure 6
Decreased lysosomal biogenesis in MAL iPSC-RPE cells. iPSC-RPE cells were cultured for 4 weeks. Subsequently, cells were incubated with or without POS for 4 weeks. (A and B) Western blot analysis of lysosome-associated markers — LAMP2, CTSD, Rab9, Rab7, and LC3 — in NOR and MAL iPSC-RPE cells. (C and D) Immunostaining of NOR and MAL iPSC-RPE cross-sections for LAMP2 (red), phalloidin (green), and DAPI (blue). (D) The quantification of LAMP2 expression is presented as fluorescence intensity per cell. (E) Immunostaining of NOR and MAL iPSC-RPE showing en face images and z stack reconstructions stained for LAMP2 (red), phalloidin (green), and DAPI (blue). (F and I–K) RNA-seq analysis of NOR and MAL iPSC-RPE cells showing expression of TFEB (F); MTOR, ATF4, and TP53 (I); CHMP4B (J), and VAMP8 (K). The y axis represents expression levels in log2 TPM. (G and H) Immunostaining of NOR and MAL iPSC-RPE cells showing en face images and z stack reconstructions stained for TFEB (red), phalloidin (green), and DAPI (blue). (H) Quantification of nuclear-to-total TFEB fluorescence ratio in NOR and MAL iPSC-RPE cells. Each dot represents an individual cell (n = 43 cells in NOR, 38 cells in MAL). Scale bar: 20 μm (C, E, and G). *P < 0.05, **P < 0.01, ***P < 0.005; 1-way ANOVA followed by the Tukey-Kramer test (F and I–K), a linear mixed-effects model followed by Tukey’s HSD test (B and D), Welch’s t test (H), n = 5 (B), n = 10 (D), n = 3 (F and I–K). Data are shown as mean ± SD. Rab9, Ras-related protein Rab-9; Rab7, Ras-related protein Rab-7; LC3, microtubule-associated protein 1 light chain 3 α; TFEB, transcription factor EB; MTOR, mechanistic target of rapamycin kinase; ATF4, activating transcription factor 4; TP53, tumor protein p53; TPM, transcripts per million; CHMP4B, charged multivesicular body protein 4B; VAMP8, vesicle-associated membrane protein 8.
Transcription factor EB (TFEB), a master regulator of lysosomal gene expression and homeostasis (23), showed reduced transcript levels in MAL iPSC-RPE cells compared with NOR iPSC-RPE cells in our RNA-seq dataset (Figure 6F). Given that TFEB is regulated by nutrient-sensing and stress-response pathways, we assessed the transcript levels of mechanistic target of rapamycin kinase (MTOR) and activating transcription factor 4 (ATF4), the latter being a key mediator of the integrated stress response and endoplasmic reticulum stress. RNA-seq analysis revealed no apparent differences in MTOR or ATF4 transcripts, whereas tumor protein p53 (TP53) transcripts were significantly upregulated in MAL iPSC-RPE (Figure 6I). At the protein level, however, neither total TFEB abundance nor TFEB phosphorylation at Ser211 — a site associated with cytoplasmic retention — showed a significant difference between NOR and MAL iPSC-RPE cells, as assessed by Western blotting (Supplemental Figure 7, A and B). Similarly, Western blot analysis of total mTOR and phosphorylated mTOR (p-mTOR) revealed no significant differences between NOR and MAL iPSC-RPE cells (Supplemental Figure 7, A and B). Consistently, confocal z-stack imaging revealed comparable gross nuclear and cytoplasmic TFEB immunoreactivity between the 2 groups (Figure 6G). However, quantitative analysis of TFEB immunofluorescence revealed a significant increase in the nuclear-to-total TFEB fluorescence ratio in MAL iPSC-RPE cells (Figure 6H), indicating relative enrichment of TFEB in the nucleus despite unchanged total protein levels. Together, these findings indicate that the reduced lysosomal biogenesis observed in MAL iPSC-RPE cells cannot be explained solely by insufficient TFEB nuclear localization, total TFEB abundance, Ser211 phosphorylation, or mTOR signaling. Instead, they suggest that TFEB-dependent lysosomal gene programs may be functionally impaired downstream of, or uncoupled from, TFEB nuclear localization — potentially reflecting maladaptive or incomplete stress-induced TFEB activation under chronic disease conditions. Additionally, the expression of charged multivesicular body protein 4B (CHMP4B), a marker of lysosomal membrane integrity (24), showed no significant difference between NOR and MAL iPSC-RPE cells (Figure 6J). This suggests that lysosomal membrane integrity is grossly preserved in MAL iPSC-RPE cells, despite reduced lysosomal abundance and impaired lysosomal function.
The expression level of Ras-related protein Rab-9 (Rab9), a key late endosome marker (25), was significantly reduced in MAL iPSC-RPE cells compared with NOR iPSC-RPE cells (Figure 6, A and B). Similarly, Rab7, another late endosome marker (25), exhibited a downward trend in MAL iPSC-RPE cells (Figure 6, A and B). Additionally, the gene expression of vesicle-associated membrane protein 8 (VAMP8), a soluble NSF-attachment protein receptor protein that localizes to late endosomes and lysosomes and facilitates vesicle fusion with the endoplasmic reticulum and cell membranes (26), was reduced in MAL iPSC-RPE cells (Figure 6K). In contrast, the expression of microtubule-associated protein 1 light chain 3 α (LC3), an autophagy marker, remained comparable between NOR and MAL iPSC-RPE cells (Figure 6, A and B). These findings suggest that, while autophagy remains unaffected, the fusion process between late endosomes and lysosomes is impaired, likely due to the reduced expression of critical lysosome-associated proteins.
Because lysosomes play a central role in the processing of phagocytosed POS, we next directly assessed POS handling in iPSC-RPE cells. Quantitative analysis of rhodopsin levels in the culture supernatant demonstrated no significant difference in POS uptake between NOR and MAL iPSC-RPE cells, indicating that the initial phagocytic capacity is preserved in MAL iPSC-RPE cells (Supplemental Figure 8, A and B). We then evaluated intracellular degradation of phagocytosed POS by measuring cellular rhodopsin levels at defined time points after POS withdrawal. In NOR iPSC-RPE cells, intracellular rhodopsin levels rapidly decreased following POS removal, indicating efficient degradation of phagocytosed POS. In contrast, MAL iPSC-RPE cells exhibited a smaller and more variable reduction in intracellular rhodopsin levels, particularly at early time points. Although these differences did not reach statistical significance, this pattern suggests a tendency toward delayed intracellular degradation of phagocytosed POS under prolonged phagocytic stress in MAL iPSC-RPE cells (Supplemental Figure 8, C and D).
To further assess the lysosomal physiology underlying the altered degradation capacity, we evaluated lysosomal acidity using LysoTracker staining followed by flow cytometric analysis. In NOR iPSC-RPE cells, LysoTracker fluorescence intensity remained comparable between 2-week and 4-week POS exposures. In contrast, MAL iPSC-RPE cells exhibited a significant reduction in LysoTracker fluorescence after 4 weeks of POS treatment, consistent with lysosomal alkalinization (Figure 7A). These findings suggest that prolonged phagocytic stress leads to impaired lysosomal acidification in MAL iPSC-RPE cells, which may contribute to delayed intracellular degradation of phagocytosed POS.
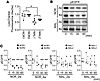 Figure 7
Lysosomal dysfunction in MAL iPSC-RPE cells. iPSC-RPE cells were cultured for 4 weeks. Subsequently, cells were incubated with or without POS for 2 or 4 weeks. (A) FACS analysis of lysosome function using LysoTracker Green. The mean fluorescence intensity at 4 weeks after POS treatment was normalized to the mean fluorescence intensity at 2 weeks of POS exposure. (B and C) Western blot and statistical analyses of phosphorylated epidermal growth factor receptor (pEGFR) in NOR and MAL iPSC-RPE cells treated with epidermal growth factor (EGF) for 6 hours, followed by measurements at 0, 15, 30, and 60 minutes after EGF removal. *P < 0.05, ***P < 0.005; P values were calculated using a linear mixed-effects model followed by Tukey’s HSD test. In C, comparisons were made versus 0 min. n = 5 (A) and n = 3 (C). Data are shown as mean ± SD.
Next, we evaluated lysosomal function in iPSC-RPE cells. Upon stimulation with epidermal growth factor (EGF), EGF receptors on the cell membrane undergo phosphorylation and are subsequently internalized and degraded by lysosomes (27). Using this mechanism, we assessed lysosomal function in MAL iPSC-RPE cells by measuring the degradation rate of phosphorylated EGFR (pEGFR) following EGF stimulation. The degradation of pEGFR was significantly slower in MAL iPSC-RPE cells than in NOR iPSC-RPE cells (Figure 7B). Notably, in MAL iPSC-RPE cells cultured with POS for 2 weeks, pEGFR degradation was observed within 60 minutes after EGF stimulation. However, in cells subjected to prolonged POS exposure (a total of 4 weeks), pEGFR degradation was markedly impaired, with no significant reduction even after 60 minutes (Figure 7, B and C). Thus, these findings indicate that lysosomal function is inherently compromised in MAL iPSC-RPE cells and that extended POS phagocytosis under near-physiological conditions exacerbates this dysfunction.
Effect of trehalose treatment to relieve lysosomal decrease and dysfunction. Because lysosomal reduction and dysfunction were observed in MAL iPSC-RPE cells, we next tested whether trehalose, a lysosome/autophagy-modulating compound reported to enhance lysosomal gene programs including TFEB-dependent pathways (23, 28), could restore lysosomal biogenesis and function. To assess whether trehalose affects TFEB activity at the level of subcellular localization, we performed immunofluorescence analysis and quantified the nuclear-to-total TFEB fluorescence intensity ratio. Trehalose treatment significantly increased the nuclear TFEB fraction in both NOR and MAL iPSC-RPE cells (Figure 8, A and B, and Supplemental Figure 9A), indicating enhanced TFEB nuclear localization under trehalose-treated conditions. Notably, total TFEB and pTFEB protein levels were not increased at the experimental endpoint, as assessed by Western blotting (Supplemental Figure 9, B and C). Consistent with this change, Western blot analysis demonstrated that trehalose treatment increased the levels of lysosome-associated proteins, LAMP2 and mature CTSD, both of which were previously reduced in MAL iPSC-RPE cells (Figure 8, C and D). Immunostaining of iPSC-RPE cells further confirmed a significant increase in punctate LAMP2 immunoreactivity following trehalose treatment (Figure 8, E–G), along with increased punctate immunoreactivity for the mannose-6-phosphate receptor (M6PR), a marker of late endosome–lysosome trafficking (29) (Figure 8H). Additionally, trehalose treatment led to an increasing trend in the expression of late endosome-related proteins Rab7 and Rab9, as well as the autophagy-related protein LC3 (Figure 8, C and D).
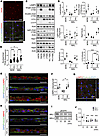 Figure 8
Improvement of lysosomal function by trehalose in MAL iPSC-RPE cells. iPSC-RPE cells were cultured for 4 weeks, followed by the addition of POS and treatment with or without 100 mM trehalose (tre) for an additional 4 weeks. (A and B) Immunostaining of MAL iPSC-RPE cells treated with trehalose showing z stack reconstructions stained for transcription factor EB (TFEB, red), phalloidin (green), and DAPI (blue). (B) Quantification of the nuclear-to-total TFEB fluorescence intensity ratio in NOR, NOR + trehalose, MAL, and MAL + trehalose iPSC-RPE cells. Sample sizes: NOR, n = 43 cells; NOR + trehalose, n = 41; MAL, n = 38; MAL + trehalose, n = 20. (C and D) Western blot analysis and statistical analyses of LAMP2, CTSD, Rab7, Rab9, and LC3 expression in NOR and MAL iPSC-RPE cells. (E and H) Immunostaining of NOR and MAL iPSC-RPE cross-sections for LAMP2 (red), phalloidin (green), and DAPI (blue, E), as well as separate cross-sectional images stained for mannose-6-phosphate receptor (M6PR) (red), phalloidin (green), and DAPI (blue, H). (F) The quantification of LAMP2 expression is presented as fluorescence intensity per cell. (G) En face image and z stack reconstructions of MAL iPSC-RPE cells treated with trehalose stained for LAMP2 (red), phalloidin (green), and DAPI (blue). (I and J) Western blot analysis of pEGFR in MAL iPSC-RPE cells treated with EGF and assessed at 0, 15, 30, and 60 minutes after EGF removal. *P < 0.05, ***P < 0.005, 1-way ANOVA followed by the Tukey-Kramer test (B), a linear mixed-effects model followed by Tukey’s HSD test (D, F, and J). In J, comparisons were made versus 0 min, n = 5 (D), n = 10 (F), n = 3 (J). Data are shown as mean ± SD. (-), not treated with trehalose; tre, treated with trehalose. Scale bar: 20 μm (A, E, G, and H).
To evaluate whether trehalose improved lysosomal function, we assessed pEGFR degradation following EGF stimulation. In trehalose-treated MAL iPSC-RPE cells, pEGFR was significantly degraded within 60 minutes after stimulation (Figure 8, I and J), suggesting a functional restoration of lysosomal activity. These findings indicate that trehalose treatment enhances both lysosomal quantity and function, offering potential therapeutic benefits for mitigating lysosomal dysfunction in MAL iPSC-RPE cells.
Suppression of drusen-like deposit formation by trehalose treatment. To determine whether restoration of lysosomal function translates into improvement of MAL-associated pathological phenotypes, we examined the effects of trehalose on drusen-like deposit formation, extracellular matrix integrity, and cell survival. In long-term cultures, MAL iPSC-RPE cells exhibited morphological degeneration, including cell flattening and excessive pigment deposition. However, trehalose treatment effectively prevented these changes, maintaining normal cellular morphology (Figure 9, A and B, and Supplemental Figure 10, A–C). Immunostaining for pERM showed no appreciable change in its apical localization pattern following trehalose treatment (Figure 9C). Additionally, trehalose significantly reduced the number of TUNEL+ apoptotic cells, restoring them to levels comparable to those in NOR iPSC-RPE cells (Figure 9, D and E).
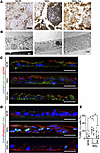 Figure 9
Rescue of cellular morphology and suppression of apoptosis by trehalose in MAL iPSC-RPE cells. iPSC-RPE cells were cultured for 4 weeks, followed by the addition of POS and treatment with or without 100 mM trehalose (tre) for an additional 4 weeks. (A) Close-up view by bright-field micrographs of NOR and MAL iPSC-RPE cells. (B) Transmission electron microscope images of vertical sections of iPSC-RPE cells. (C) Immunostaining of NOR and MAL iPSC-RPE cross-sections for pERM (red), phalloidin (green), and DAPI (blue). (D and E) TUNEL staining (green) of cross-sections of NOR and MAL iPSC-RPE cells. Scale bar: 200 μm (A), 2 μm (B), 20 μm (C and D). *P < 0.05, a linear mixed-effects model followed by Tukey’s HSD test, n = 10 (E). Data are shown as mean ± SD. (-), not treated with trehalose; tre, treated with trehalose.
While overall fibulin-3 expression levels remained unchanged (Figure 10, A and B), trehalose treatment altered the distribution pattern of fibulin-3 immunoreactivity, with a reduction in dense fibulin-3+ structures (Figure 10, C and D). Likewise, α-synuclein aggregation was diminished following treatment (Supplemental Figure 10, D–F). Trehalose treatment also altered the intracellular distribution of ApoE, reducing the intensity and aggregation of enlarged intracellular ApoE+ puncta (Figure 10, E–G), while total ApoE protein levels were maintained or increased (Figure 10, A and B). In parallel, ApoE immunoreactivity became more prominent as fine signals in the membrane-adjacent region, consistent with redistribution rather than enhanced intracellular aggregation. Similarly, C3 aggregates, which are typically abundant in MAL iPSC-RPE cells, were significantly reduced (Figure 10, H and I). Moreover, trehalose treatment disrupted the fibrotic accumulation of collagen IV (Figure 10, J and K) and led to a reduction in MMP2 expression (Figure 10, L and M), suggesting improved extracellular matrix integrity. Collectively, these results suggest that trehalose restores lysosomal function in MAL iPSC-RPE cells, which may help inhibit drusen-like deposit formation, reinforce the extracellular matrix and prevent cell death, highlighting its potential therapeutic benefits.
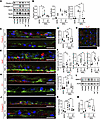 Figure 10
Improvement of drusen-like deposits and extracellular matrix dysregulation by trehalose in MAL iPSC-RPE cells. iPSC-RPE cells were cultured for 4 weeks, followed by the addition of POS and treatment with or without 100 mM trehalose (tre) for an additional 4 weeks. (A and B) Western blot analysis of fibulin-3, ApoE, and collagen type IV in NOR and MAL iPSC-RPE cells. (C–F and H–K) Immunostaining of cross-sections of MAL iPSC-RPE cells with or without trehalose treatment for fibulin-3 (red, C), ApoE (red, E), C3 (red, H), or collagen IV (red, J), together with phalloidin (green) and DAPI (blue). (G) Immunostaining of MAL iPSC-RPE cells treated with trehalose showing en face images and z stack reconstructions stained for LAMP2 (red), phalloidin (green), and DAPI (blue). (D, F, I, and K) Quantification of fibulin-3 (D) and collagen type IV (K) fluorescence intensity; intracellular ApoE metrics, including the proportion of cells with intracellular ApoE+ puncta-containing cells, intracellular ApoE [ApoE (intra)] fluorescence intensity, and basal ApoE fluorescence intensity in NOR and MAL iPSC-RPE cells treated with or without trehalose (F); or C3+ puncta (I), comparing NOR, MAL, and trehalose-treated MAL iPSC-RPE cells. Student’s t test; n = 10. (L and M) Western blot analysis of MMP2 in NOR and MAL iPSC-RPE cells. Scale bar: 20 μm (C, E, G, H, and J). *P < 0.05, **P < 0.01, ***P < 0.005, a linear mixed-effects model followed by Tukey’s HSD test, n = 5 (B and M), n = 10 (D, F, I, and K). Data are shown as mean ± SD. (-), not treated with trehalose; tre, treated with trehalose.
Given previous reports implicating intracellular lipid dysregulation in MAL (14) and our prior demonstration that lipid extraction with 2-hydroxypropyl-β-cyclodextrin (HPBCD) improves lysosomal function in iPSC-RPE cells derived from patients with Bietti crystalline dystrophy (30), we also evaluated HPBCD treatment as a comparative approach in MAL iPSC-RPE cells. However, treatment with HPBCD failed to restore lysosomal enzyme expression. Additionally, HPBCD treatment did not prevent drusen-like deposit formation, extracellular matrix weakening, or apoptosis in MAL iPSC-RPE cells (Supplemental Figure 11).


