Research ArticleCell biologyMuscle biology
Open Access | ![]() 10.1172/jci.insight.182471
10.1172/jci.insight.182471
Sex-dependent and muscle-specific progression of the MYBPC1 E248K Myotrem myopathy in response to aging
Jennifer M. Mariano,1 Humberto C. Joca,1 Jacob Kallenbach,2 Natasha Ranu,3 Julien Ochala,3,4 Christopher Ward,2 and Aikaterini Kontrogianni-Konstantopoulos1
1Department of Biochemistry and Molecular Biology and
2Department of Orthopaedics, University of Maryland School of Medicine, Baltimore, Maryland, USA.
3Centre of Human and Applied Physiological Sciences, School of Basic and Medical Biosciences, Faculty of Life Sciences & Medicine, King’s College London, London, United Kingdom.
4Biomedical Institute, University of Copenhagen, Copenhagen, Denmark.
Address correspondence to: Aikaterini Kontrogianni-Konstantopoulos, 108 N. Greene St., Baltimore, Maryland, 21201, USA. Phone: 410.706.5788; Email: akontrogianni@som.umaryland.edu.
Find articles by Mariano, J. in: PubMed | Google Scholar
1Department of Biochemistry and Molecular Biology and
2Department of Orthopaedics, University of Maryland School of Medicine, Baltimore, Maryland, USA.
3Centre of Human and Applied Physiological Sciences, School of Basic and Medical Biosciences, Faculty of Life Sciences & Medicine, King’s College London, London, United Kingdom.
4Biomedical Institute, University of Copenhagen, Copenhagen, Denmark.
Address correspondence to: Aikaterini Kontrogianni-Konstantopoulos, 108 N. Greene St., Baltimore, Maryland, 21201, USA. Phone: 410.706.5788; Email: akontrogianni@som.umaryland.edu.
Find articles by Joca, H. in: PubMed | Google Scholar
1Department of Biochemistry and Molecular Biology and
2Department of Orthopaedics, University of Maryland School of Medicine, Baltimore, Maryland, USA.
3Centre of Human and Applied Physiological Sciences, School of Basic and Medical Biosciences, Faculty of Life Sciences & Medicine, King’s College London, London, United Kingdom.
4Biomedical Institute, University of Copenhagen, Copenhagen, Denmark.
Address correspondence to: Aikaterini Kontrogianni-Konstantopoulos, 108 N. Greene St., Baltimore, Maryland, 21201, USA. Phone: 410.706.5788; Email: akontrogianni@som.umaryland.edu.
Find articles by Kallenbach, J. in: PubMed | Google Scholar
1Department of Biochemistry and Molecular Biology and
2Department of Orthopaedics, University of Maryland School of Medicine, Baltimore, Maryland, USA.
3Centre of Human and Applied Physiological Sciences, School of Basic and Medical Biosciences, Faculty of Life Sciences & Medicine, King’s College London, London, United Kingdom.
4Biomedical Institute, University of Copenhagen, Copenhagen, Denmark.
Address correspondence to: Aikaterini Kontrogianni-Konstantopoulos, 108 N. Greene St., Baltimore, Maryland, 21201, USA. Phone: 410.706.5788; Email: akontrogianni@som.umaryland.edu.
Find articles by Ranu, N. in: PubMed | Google Scholar
1Department of Biochemistry and Molecular Biology and
2Department of Orthopaedics, University of Maryland School of Medicine, Baltimore, Maryland, USA.
3Centre of Human and Applied Physiological Sciences, School of Basic and Medical Biosciences, Faculty of Life Sciences & Medicine, King’s College London, London, United Kingdom.
4Biomedical Institute, University of Copenhagen, Copenhagen, Denmark.
Address correspondence to: Aikaterini Kontrogianni-Konstantopoulos, 108 N. Greene St., Baltimore, Maryland, 21201, USA. Phone: 410.706.5788; Email: akontrogianni@som.umaryland.edu.
Find articles by Ochala, J. in: PubMed | Google Scholar
1Department of Biochemistry and Molecular Biology and
2Department of Orthopaedics, University of Maryland School of Medicine, Baltimore, Maryland, USA.
3Centre of Human and Applied Physiological Sciences, School of Basic and Medical Biosciences, Faculty of Life Sciences & Medicine, King’s College London, London, United Kingdom.
4Biomedical Institute, University of Copenhagen, Copenhagen, Denmark.
Address correspondence to: Aikaterini Kontrogianni-Konstantopoulos, 108 N. Greene St., Baltimore, Maryland, 21201, USA. Phone: 410.706.5788; Email: akontrogianni@som.umaryland.edu.
Find articles by
Ward, C.
in:
PubMed
|
Google Scholar
|

1Department of Biochemistry and Molecular Biology and
2Department of Orthopaedics, University of Maryland School of Medicine, Baltimore, Maryland, USA.
3Centre of Human and Applied Physiological Sciences, School of Basic and Medical Biosciences, Faculty of Life Sciences & Medicine, King’s College London, London, United Kingdom.
4Biomedical Institute, University of Copenhagen, Copenhagen, Denmark.
Address correspondence to: Aikaterini Kontrogianni-Konstantopoulos, 108 N. Greene St., Baltimore, Maryland, 21201, USA. Phone: 410.706.5788; Email: akontrogianni@som.umaryland.edu.
Find articles by
Kontrogianni-Konstantopoulos, A.
in:
PubMed
|
Google Scholar
|
Published June 26, 2025 - More info
JCI Insight. 2025;10(15):e182471. https://doi.org/10.1172/jci.insight.182471.
© 2025 Mariano et al. This work is licensed under the Creative Commons Attribution 4.0 International License. To view a copy of this license, visit http://creativecommons.org/licenses/by/4.0/.
Received: April 26, 2024; Accepted: June 18, 2025

-
Results
Phenotypic and behavioral evaluation of the MYBPC1 E248K murine model in mid- and late adulthood. To characterize the age-dependent progression of the MYBPC1-associated Myotrem myopathy, we utilized the established E248K murine model that we previously generated (12). No difference in survival was observed across 4 weeks to 24 months of age between WT and heterozygous KI animals for both males (Supplemental Figure 1A; supplemental material available online with this article; https://doi.org/10.1172/jci.insight.182471DS1) and females (Supplemental Figure 1B). Using a battery of phenotypic and behavioral assays, we set forth to study the manifestation and progression of the E248K Myotrem myopathy at 12 and 24 months, corresponding to mid (40–45 human years) and late (70–75 human years) adulthood, respectively (14). For each age assessed, males and females were analyzed separately, and KI animals were compared with age- and sex-matched WT littermates.
Gross neuromuscular performance assessed by an inverted hang test identified significant deficits in both male and female KI mice at 12 and 24 months compared with their sex- and age-matched WT littermates (Supplemental Figure 1, C–F), consistent with generalized neuromuscular impairment. Musculoskeletal quality and body composition were evaluated using dual energy x-ray absorptiometry (DEXA). At 12 months, KI males tended to be more kyphotic (Supplemental Figure 2, A and B) and exhibited significantly reduced body and fat mass (Supplemental Figure 2, C and D), yet higher lean mass (Supplemental Figure 2D), compared with their WT counterparts. As male E248K mice aged to 24 months, these features were largely preserved (Supplemental Figure 2, E–H). Female KI mice were likewise kyphotic at 12 months (Supplemental Figure 2, I and J) but displayed similar body (Supplemental Figure 2K), lean, and fat (Supplemental Figure 2L) mass relative to their WT littermates. At 24 months, female KI mice retained their kyphotic presentation (Supplemental Figure 2, M and N), with significant decline in body mass (Supplemental Figure 2O) underscored by lower lean and fat mass (Supplemental Figure 2P), compared with sex- and age-matched WT.
We also evaluated phenotypic behavior by observing lone mice placed in a large cage. At 12 months, WT mice of both sexes engaged in normal exploratory activities, such as roaming, rearing, sniffing, and grooming (Supplemental Videos 1 and 2). This behavior persisted at 24 months, albeit with reduced ambulation, as expected in older animals (Supplemental Videos 3 and 4). Notably, WT mice showed no signs of tremor at either 12 or 24 months, regardless of sex. KI mice of both sexes (Supplemental Videos 5 and 6) also displayed exploratory behaviors at 12 months but showed evidence of tremor during rearing. Furthermore, mid-adult KI males exhibited an affected gait, likely due to contractures in the hindlimb (Supplemental Video 5). By 24 months, KI male mice presented a pronounced tremor during rearing, grooming, and at rest (Supplemental Video 7), along with decreased ambulation and difficulty rearing. Conversely, KI female mice (Supplemental Video 8) showed a more variable phenotype at 24 months. While tremor was consistently evident, the severity along with the extent of impaired gait varied across mice. Thus, although the 2 sexes shared some deficiencies (e.g., neuromuscular impairment and tremor occurrence), they also developed distinct manifestations (e.g., skeletal abnormalities, body composition, tremor severity) as they aged.
Evaluation of soleus contractile function in aging E248K Myotrem mice. Muscle weakness is a major manifestation in patients with Myotrem (9, 10, 15–18). In agreement with this, our earlier work demonstrated contractile impairment in young (2- and 4-week-old) MYBPC1 E248K mice (12). Given that patients with Myotrem reach a phase of stabilization in early adulthood, it remains unknown whether the observed functional alterations persist into mid- and late adulthood. To address this question, we first assessed contractile performance in the soleus muscle comprising part of the triceps surae (a.k.a. calf muscle) responsible for plantarflexion of the foot. Given that soleus muscle is composed of a large portion of slow-twitch fibers having abundant sMyBP-C, we considered this a sentinel muscle for tracking a pathogenic impact and its progression. Male and female WT and KI mid-adult (12-month-old) and late-adult (24-month-old) mice were analyzed separately. We utilized an ex vivo system where intact soleus muscle was placed in an oxygenated bath of Ringer’s solution and was field stimulated to induce isometric contractions, during which resulting force was measured. The force versus stimulation frequency relationship was profiled at increasing frequencies from 1 to 200 Hz, which span the range for voluntary motor activity (19–21). Contractile kinetics were evaluated at 200 Hz.
Examining WT and KI male solei at 12 months, we revealed a significant reduction in force production, despite no change in muscle mass (Figure 1, A–D). Normalizing the force to the physiological cross-sectional area (PCSA; Figure 1B), we found this force deficit to persist (Figure 1E). Quantifying the contractile kinetics, we identified a significant decline in contraction rate (Figure 1F) in the KI solei with no change in the rate of relaxation (Figure 1G). Extending this ex vivo evaluation to soleus from 12-month female WT and KI mice (Figure 2), we observed similar patterns to those of mid-adult males. Accordingly, solei mass (Figure 2A) and PCSA (Figure 2B) were comparable between WT and KI female mice at 12 months. Moreover, the KI female solei displayed similar contractile deficits with respect to tetanic absolute (Figure 2, C and D) and specific force (Figure 2E) as well as contraction kinetics (Figure 2F), while relaxation kinetics remained unaltered (Figure 2G), consistent with our findings in males.
 Figure 1
Ex vivo contractile function of 12-month-old male soleus muscle. (A and B) Soleus morphometric parameters were similar between WT and Knock-In (KI) mice in terms of mass (A) and physiological cross-sectional area (PCSA; B). (C) Soleus muscles from 12-month-old WT and KI male mice were mounted to a force transducer and a rigid pole on each end, and they were immersed in an ex vivo bath. Muscles were subsequently subjected to brief pulses of field stimulation between 1 and 200 Hz, and a force-frequency relationship was generated at tetanic stimulation (200 Hz). (D–F) KI male soleus muscle produced significantly reduced absolute force (D); specific force, defined as absolute force divided by PCSA (E); and rate of contraction (F) at 12 months compared with age- and sex-matched WT. (G) However, no statistical difference was observed in relaxation rate; n = 5 WT and n = 4 KI mice. Data are presented as mean ± SEM, and force traces are shown over a 1,500 msec period with a sampling rate of 125 Hz. Statistical significance was determined by 2-tailed Student’s t test (A, B, F, and G) and 2-way ANOVA followed by Šídák’s multiple comparisons test (D and E); NS, not significant; **P < 0.01 and ****P < 0.0001.
 Figure 2
Ex vivo contractile function of 12-month-old female soleus muscle. (A and B) Morphometric evaluation of WT and KI 12-month-old females indicated similar soleus mass (A) and physiological cross-sectional area (PCSA; B). (C–F) Evaluation of ex vivo contractile function following tetanic stimulation (C) revealed dampened absolute force (D), specific force (E), and contraction rate (F) in KI female soleus muscle compared with sex- and age-matched WT. (G) However, changes in relaxation rate did not reach statistical significance; n = 5 mice per genotype. Data are presented as mean ± SEM, and force traces are shown over a 1,500 msec period with a sampling rate of 125 Hz. Statistical significance was determined by 2-tailed Student’s t test (A, B, F, and G) and 2-way ANOVA followed by Šídák’s multiple comparisons test (D and E); NS, not significant; **P < 0.01, ***P < 0.001, and ****P < 0.0001.
At 24 months of age, KI male solei continued to exhibit similar mass and PCSA (Supplemental Figure 3, A and B) but impaired absolute (Supplemental Figure 3, C and D) and specific (Supplemental Figure 3E) force measurements when compared with age- and sex-matched WT, while contraction (Supplemental Figure 3F) and relaxation (Supplemental Figure 3G) kinetics appeared unchanged. The 24-month-old KI female mice also displayed statistically similar solei mass (Supplemental Figure 4A) and PCSA (Supplemental Figure 4B) to their WT counterparts, albeit with a noticeable declining trend. Accordingly, while tetanic absolute force (Supplemental Figure 4, C and D) was significantly reduced, specific force (Supplemental Figure 4E) was comparable with WT. Similar to late-adult male KI solei, contraction (Supplemental Figure 4F) and relaxation (Supplemental Figure 4G) kinetics of female KI solei were unaltered at 24 months. Thus, akin to what we previously reported in young E248K animals (12), contractile impairment of soleus muscle largely persists through mid- and late stages of adulthood for both males and females. Given that these measures were made ex vivo and independent of the nerve, the underlying mechanisms were intrinsic to the muscle fiber.
Examination of gastrocnemius contractile function in aging E248K Myotrem mice. We subsequently sought to evaluate contractile function of gastrocnemius, a large predominantly fast-twitch muscle located superficially to the soleus. To do so, we used an in vivo system where the mouse hindlimb was immobilized, the peroneal nerve was percutaneously stimulated between 1 and 150 Hz to evoke isometric contractions, and the resulting isometric force was quantified at increasing frequencies of stimulation.
Similar to the soleus at 12 months, the mass of gastrocnemius muscle in 12-month-old KI male mice was comparable with WT (Supplemental Figure 5A). Surprisingly, however, tetanic absolute (Supplemental Figure 5, B and C) and specific (Supplemental Figure 5D) force as well as contraction (Supplemental Figure 5E) and relaxation (Supplemental Figure 5F) kinetics were unaltered. This pattern of comparable gastrocnemius morphometry and contractile function between WT and KI mice was also apparent in 12-month-old females (Supplemental Figure 6, A–F), 24-month-old males (Supplemental Figure 7, A–F), and 24-month-old females (Supplemental Figure 8, A–E), with the exception of relaxation kinetics (Supplemental Figure 8F), which were markedly depressed in the latter group. Taken together, gastrocnemius muscle exhibited no to minimal effect compared with soleus muscle in E248K KI mice in mid- and late adulthood.
Assessment of tibialis anterior contractile function in aging E248K Myotrem mice. We also quantified the in vivo contractility of the tibialis anterior (TA) muscle, a large predominantly fast-twitch muscle responsible for dorsiflexion of the ankle. At 12 months, KI males exhibited significantly, yet modestly, smaller TA mass (Figure 3A) but showed comparable force production (Figure 3, B–D) and kinetics (Figure 3, E and F) to WT males. Parallel to males, 12-month-old KI females showed a similar TA morphometric change (Figure 4A) and comparable contractile function (Figure 4, B–F) to their WT counterparts.
 Figure 3
In vivo contractile function of 12-month-old male tibialis anterior muscle. Contractility was assessed using in vivo nerve-evoked isometric contractions. WT and KI mice were anesthetized, the hindlimb was immobilized, and the common peroneal nerve was percutaneously stimulated by brief (500 msec) trains of pulses delivered at 1 to 150 Hz. (A) Isolated tibialis anterior (TA) muscle mass was smaller in KI males when compared with WT males at 12 months. (B) Representative force traces of TA dorsiflexion of WT and KI 12-month-old mice resulting from 150 Hz stimulation. (C) Left: Force versus stimulation frequency curve. Absolute tetanic force (150 Hz; C, right), specific tetanic force calculated by dividing the absolute tetanic force with the muscle mass (D), and the rates of contraction (E) and relaxation (F) were similar between male WT and KI TA muscles at 12-months; n = 10 mice per genotype. Data are presented as mean ± SEM, and force traces are shown over a 1,000 msec period with a sampling rate of 125 Hz. Statistical significance was determined by 2-tailed Student’s t test (E and F), Mann-Whitney U test (A), and 2-way ANOVA followed by Šidák’s test for multiple comparisons (C and D); NS, not significant;*P < 0.05.
 Figure 4
In vivo contractile function of 12-month-old female tibialis anterior muscle. Contractility was assessed using in vivo nerve-evoked isometric contractions. The common peroneal nerve was percutaneously stimulated by brief (500 msec) trains of pulses delivered at 1–150 Hz. (A–F) KI female tibialis anterior (TA) muscles exhibited comparable mass (A) and developed similar absolute tetanic force (B and C), specific tetanic force (D), and contraction (E) and relaxation (F) kinetics to WT; n = 10 mice per genotype. Data are presented as mean ± SEM, and force traces are shown over a 1,000 msec period with a sampling rate of 125 Hz. Statistical significance was determined by 2-tailed Student’s t test (A and E), 2-tailed Welch’s t test (F), and 2-way ANOVA followed by Šidák’s test for multiple comparisons (C and D). NS, not significant.
KI male mice at 24 months of age deviated from the general pattern of contractile preservation observed in mid-adulthood. While similarities in TA mass were conserved (Figure 5A), contractile performance following tetanic stimulation (Figure 5B) was drastically impaired in 24-month-old KI TA muscle compared with WT, as evidenced by significant depression in both absolute (Figure 5C) and specific (Figure 5D) force as well as contractility kinetics (Figure 5, E and F). Interestingly, this decline in male KI TA function in late adulthood did not carry over to female KI TA muscle. Despite the smaller mass of female KI TA muscle compared with WT at 24 months (Figure 6A), contractile stabilization was evident (Figure 6, B–F). Thus, while both KI males and females exhibited similar TA contractile function to their WT counterparts in mid-adulthood, by late adulthood males, but not females, showed a sharp decline in both force production and contractility kinetics.
 Figure 5
In vivo contractile function of 24-month-old male tibialis anterior muscle. Contractility was assessed using in vivo nerve-evoked isometric contractions. The common peroneal nerve was percutaneously stimulated by brief (500 msec) trains of pulses delivered at 1–150 Hz. (A) The mass of WT and KI tibialis anterior (TA) male muscles was similar at 24 months. (B–F) However, KI TA muscle developed significantly reduced absolute tetanic force (B and C), specific force (D), and contraction (E) and relaxation (F) rates compared with age- and sex-matched WT muscle; n = 11 WT and n = 10 KI mice. Data are presented as mean ± SEM, and force traces are shown over a 1,000 msec period with a sampling rate of 125 Hz. Statistical significance was determined by 2-tailed Student’s t test (B), Mann-Whitney U test (A and C), and 2-way ANOVA followed by Šidák’s test for multiple comparisons (C and D); NS, not significant; *P < 0.05, **P < 0.01, ***P < 0.001, and ****P < 0.0001.
 Figure 6
In vivo contractile function of 24-month-old female tibialis anterior muscle. Contractility was assessed using in vivo nerve-evoked isometric contractions. The common peroneal nerve was percutaneously stimulated by brief (500 msec) trains of pulses delivered at 1 to 150 Hz. (A) At 24 months, KI female tibialis anterior (TA) muscles exhibited smaller muscle mass compared with WT. (B–F) Absolute tetanic force (B and C), specific force (D), and the rates of contraction (E) and relaxation (F) were comparable between KI and WT muscles; n = 10 WT and n = 11 KI mice. Data are presented as mean ± SEM, and force traces are shown over a 1,000 msec period with a sampling rate of 125 Hz. Statistical significance was determined by 2-tailed Student’s t test (E), 2-tailed Welch’s t test (A and F), and 2-way ANOVA followed by Šidák’s test for multiple comparisons (C and D); NS, not significant; *P < 0.05.
Collectively, these findings indicate that Myotrem soleus muscle consistently displayed contractile deficits, gastrocnemius muscle reliably exhibited functional preservation, whereas TA muscle showed a differential impairment profile influenced by both sex and age.
Evaluation of sarcomeric structure, sMyBP-C expression, and myosin relaxation state of male and female E248K TA muscles. To investigate potential cellular alterations underlying the unique sex- and age-dependent phenotype of KI TA muscle, we employed a variety of biochemical and imaging assays. Immunoblotting coupled with densitometry was used to evaluate the relative expression levels of sMyBP-C in TA muscle. To gain insights into biochemical alterations potentially preceding the observed functional deficits, we included 6-month-old mice in our analysis. sMyBP-C expression was nondifferent between male WT and KI TA muscles at 6 (Supplemental Figure 9A), 12 (Supplemental Figure 9B), or 24 (Supplemental Figure 9C) months. In contrast, female KI TA muscles exhibited an upregulation in sMyBP-C levels at 6 months (Supplemental Figure 9D), shifting to a notable decrease by 12 months (Supplemental Figure 9E); however, this reduction did not achieve statistical significance at 24 months, likely due to the large variability in sMyBP-C expression among KI female muscles (Supplemental Figure 9F).
Since MyBP-C is implicated in the regulation of the myosin relaxation state (22–24), we utilized Mant-ATP chase single nucleotide turnover assays to determine the ratio of myosin heads in disordered-relaxed (DRX; defined by faster ATPase activity and higher force-generating potential) versus super-relaxed (SRX; defined by slower ATPase activity and lower force-generating potential) states. Similar ratios (P) and lifetimes (T) of myosin heads in DRX (P1, T1) versus SRX (P2, T2) states were measured between WT and KI TA myofibers from 12-month-old male mice (Supplemental Figure 10, A–E), both of which persisted at 24 months (Supplemental Figure 10, F–J). Conversely, myofibers from 12-month-old KI females exhibited a significant increase of myosin heads in the energy-consuming DRX state (Supplemental Figure 10, K and L) and a reciprocal decrease in the energy-saving SRX state (Supplemental Figure 10, K and M) compared with sex- and age-matched WT. T1 and T2 lifetimes in 12-month-old KI females, however, remained unaltered (Supplemental Figure 10, N and O). These results are consistent with the downregulation of sMyBP-C expression in mid-adult KI females (Supplemental Figure 9E), since MyBP-C is thought to stabilize the SRX confirmation of myosin (25). By 24 months, this shift in myosin populations is less pronounced (Supplemental Figure 10P), leading to no significant differences in P1 (Supplemental Figure 10Q) and P2 (Supplemental Figure 10R) ratios between WT and KI female myofibers, and comparable T1 and T2 lifetimes (Supplemental Figure 10, S and T). Therefore, in KI females, but not males, alterations in sMyBP-C expression and, consequently, myosin relaxation state could stabilize TA contractility in mid-adulthood.
Quantitative analysis of sarcomeric structure of mid- and late adult male and female TA. Given the essential role of sMyBP-C in myofibrillar assembly and maintenance (1, 13), we quantitatively assessed the structural organization of TA tissue of mid- and late-adult male and female mice. TA muscle sections were immunostained for the Z-disk marker α-actinin and sMyBP-C (Supplemental Figure 11, A–F) and were scored for levels of sarcomeric breakage, continuity, and order along with sMyBP-C localization (Supplemental Figure 11, G–N). The breakage, continuity, and order scores were comprehensively evaluated to determine whether tissues reflected prototypic sarcomeric organization (Supplemental Figure 12A) or distinct patterns of sarcomeric abnormalities, including lateral misalignment, sarcomeric continuum, disordered organization, and chaotic organization (Supplemental Figure 12 B–E). Although areas of disorganization were observed in KI TA male muscles at 12 months of age (Figure 7A), quantification of overall sarcomeric structure revealed comparable levels of myofibrillar breakage (Figure 7B), continuity (Figure 7C), and order (Figure 7D) between WT and KI, indicating a preservation of prototypic sarcomeric organization (Supplemental Figure 12A). Relatedly, sMyBP-C was properly localized to the C-zone of A-bands in mid-adult WT and KI male TA muscles (Figure 7, A, E, and F). Similarly, 12-month female TA muscles (Figure 8A) also displayed similar levels of myofibrillar breakage (Figure 8B), continuity (Figure 8C), and order (Figure 8D), while sMyBP-C was properly targeted to the C-zone (Figure 8, A, E, and F). Therefore, sarcomeric structure appeared preserved in KI male and female TA muscles in mid-adulthood, consistent with the contractile stabilization observed at this time point.
 Figure 7
Quantitative evaluation of sarcomeric structure in 12-month-old male tibialis anterior muscle. (A) Representative images of tibialis anterior (TA) muscle sections labeled for α-actinin and slow Myosin Binding Protein-C (sMyBP-C). Scale bar: 5 μm. (B–D) Quantification of overall myofibrillar structure performed on α-actinin–stained images revealed comparable breakage (B), continuity (C), and order (D) scores between WT and KI TA male muscles at 12 months. (E) Linear profiles of α-actinin and sMyBP-C relative intensities confirmed their alternating distribution, corresponding to Z-disk and C-zone localization, respectively; the regions of interest (ROIs) used for analysis are denoted with a white rectangle in the merged images. (F) sMyBP-C exhibited similar localization scores in WT and KI TA male muscles at 12 months, as determined via Fast Fourier Transform (FFT) analysis. n = 3 mice per genotype and n′ = 5 images per muscle. Data are presented as mean ± SEM, and statistical significance was determined with 2-tailed Student’s t test (B and D) or Mann-Whitney U test (C and F). NS, not significant.
 Figure 8
Quantitative evaluation of sarcomeric structure in 12-month-old female tibialis anterior muscle. (A) Representative images of tibialis anterior (TA) muscle sections immunostained for α-actinin and slow Myosin Binding Protein-C (sMyBP-C). Scale bar: 5 μm. (B–D) At 12 months, KI female TA muscle exhibits similar levels of breakage (B), continuity (C), and order (D) to age- and sex-matched WT tissue. (E) Relative intensity profiles of α-actinin and sMyBP-C confirmed their alternating distribution, corresponding to Z-disk and C-zone distribution, respectively; the regions of interest (ROIs) used for analysis are indicated with a white rectangle in the merged images. (F) sMyBP-C exhibited comparable localization scores between WT and KI TA female muscles at 12 months, as calculated via Fast Fourier Transform (FFT) analysis. n = 3 mice per genotype and n’ = 5 images per muscle. Data are presented as mean ± SEM, and statistical significance was determined by 2-tailed Student’s t test (B and D) and Mann-Whitney U test (C and F) NS, not significant.
Interestingly, examination of the structural organization of 24-month-old KI male TA muscles, which exhibited contractile impairment (Figure 5), uncovered severe structural deficits (Figure 9A). Late-adult male TA muscle exhibited higher breakage (Figure 9B), along with lower continuity (Figure 9C) and order (Figure 9D) scores compared with sex- and age-matched WT tissue, indicative of a pattern of chaotic organization (Supplemental Figure 12E). Consistently, sMyBP-C assumed a disordered distribution in KI TA male muscle at 24 months (Figure 9A), failing to assemble in the typical C-zone doublets seen in WT muscle (Figure 9, A and E). This was further substantiated by the markedly lower localization score of sMyBP-C in 24-month-old male KI TA muscle compared with sex- and aged-matched WT (Figure 9F). Notably, TA muscles from 24-month-old females, which conversely showed persistent contractile stabilization through late adulthood, retained sarcomeric structural integrity (Figure 10A), as quantified by breakage (Figure 10B) and order (Figure 10D) scores, which were comparable with sex- and age-matched WT. Interestingly though, late-adult female TA muscles displayed a higher continuity score relative to WT (Figure 10C), indicative of a sarcomeric continuum, characterized by a wavelike pattern of structural (mal)adaptation (Supplemental Figure 12C). Moreover, sMyBP-C properly occupied the sarcomeric C-zone in 24-month female TA muscles of both genotypes (Figure 10, A and E), as reflected by their similar localization scores (Figure 10F). Taken together, our observations indicate that the degree of structural (dis)organization in E248K TA muscles aligns with contractile (dys)function, in an age- and sex-dependent fashion, underscoring the critical role of sMyBP-C in upholding sarcomeric structure/function.
 Figure 9
Quantitative evaluation of sarcomeric structure in 24-month-old male tibialis anterior muscle. (A) Representative images of tibialis anterior (TA) muscle sections colabeled for α-actinin and slow Myosin Binding Protein-C (sMyBP-C). Scale bar: 5 μm. (B–D) Contrary to 12 months, at 24 months KI male TA muscles displayed significantly increased breakage (B) and markedly decreased continuity (C) and order (D) scores compared with sex- and age-matched WT tissue. (E and F) Consistently, sMyBP-C failed to occupy the typical C-zone doublets, as shown in linear plots of the relative intensity profiles of α-actinin and sMyBP-C (E; the ROI used for analysis are outlined by a white rectangle in the merged images), and the significantly reduced sMyBP-C localization score of KI TA muscles compared with WT (F); n = 3 mice per genotype and n’ = 5 images per muscle. Data are presented as mean ± SEM, and statistical significance was determined by 2-tailed Student’s t test (B and F) and Mann-Whitney U test (C); *P < 0.05, **P < 0.01, and ***P < 0.001.
 Figure 10
Quantitative evaluation of sarcomeric structure in 24-month-old female tibialis anterior muscle. (A) Representative images of tibialis anterior (TA) tissue sections were immunolabeled for α-actinin and slow Myosin Binding Protein-C (sMyBP-C). Scale bar: 5 μm. (B–D) Relative to WT female TA muscles, KI muscles exhibited comparable breakage (B), increased continuity (C), and similar order (D) scores. (E and F) Moreover, sMyBP-C assumed its typical doublet distribution at sarcomeric C-zones in both WT and KI TA muscles, as shown in linear plots of the relative intensity profiles of α-actinin and sMyBP-C (E; the ROI used for analysis are marked with a white rectangle in the merged images), and similar sMyBP-C localization scores (F); n = 3 mice per genotype and n’ = 5 images per mouse. Data are presented as mean ± SEM, and statistical significance was determined by 2-tailed Student’s t test (B and D) and Mann-Whitney U test (C and F); NS, not significant;*P < 0.05.


-
Methods
Sex as a biological variable. Our study examined male and female animals, and sex-dimorphic effects are reported.
Survival curves. Kaplan-Meier curves were generated for WT and heterozygous KI animals from 4 weeks through 24 months of age. Statistical significance comparing survival rates between WT and KI was performed using the log-rank test.
Inverted hang assay. Mice were placed on a wire grid hung ~50 cm above a soft padded surface. The grid was slowly inverted over a time period of 2 seconds. Hang time was measured as the time from full inversion to until the animal dropped. If the mouse did not fall after 3 minutes, the assay was stopped, and the maximum time of 180 seconds was recorded. The animal was returned to its cage and allowed to rest for at least 3 minutes. The assay was repeated 3 times in 1 day. Individual data points reflect the average of these 3 trials per animal.
DEXA. Animals were lightly anesthetized and exposed to DEXA (iNSiGHT VET DXA, Osteosys) scans. For body composition measurements, the animals were placed in a prone position during the scan. A region of interest (ROI) of the animal body excluding the head and tail was used for estimations of total mass, lean mass, and fat mass. For spinal curvature measurements, the animal was placed in a right lateral recumbent position during the scan. Kyphotic index was determined as previously described (12, 53) by calculating the ratio of the distance between the C7 and L6 vertebrae and the length of a perpendicular line reaching the extreme dorsal curvature of the spine.
Ex vivo assessment of soleus contractile function. In vaporized isoflurane-anesthetized mice, the soleus was secured with sutures at each tendon, immersed in an ex vivo temperature-controlled (25°C) perfusion bath of oxygenated (95% O2, 5% CO2) Ringer’s solution (140 mM NaCl, 4 mM KCl, 1 mM MgSO4, 10 mM HEPES, 10 mM glucose, 5 mM NaHCO3, 1.8 mM CaCl2, pH 7.4), and mounted to a length controller and force transducer (1200A, Aurora Scientific) at optimal length. Optimal length (L0) was determined by iteratively adjusting muscle length to achieve maximal twitch (1 Hz) force. The force-frequency relationship was determined by delivering brief (500 ms) trains of field pulses of 1–200 Hz delivered by plate electrodes parallel to each side of the muscle. The resulting force of isometric contraction was measured at a sampling rate of 10,000 Hz. PCSA was calculating using the equation,
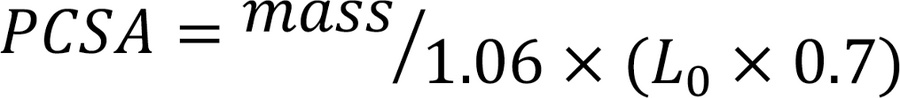 where mass is the isolated soleus mass and L0 is optimal length. Soleus specific force was calculated by dividing the absolute peak force by the PCSA. Measurements from tetanic stimulation (200 Hz) were used as outcome variables.
In vivo assessment of gastrocnemius and TA function. In vaporized isoflurane-anesthetized mice, the hindlimb was immobilized at the knee and the foot was secured to a force transducer (1300A, Aurora Scientific). The tibial nerve was then stimulated with brief (500 msec) trains of pulses delivered at 1–150 Hz to elicit isometric contractions of the gastrocnemius muscle, and the resulting force was measured. The protocol was repeated, stimulating the common peroneal nerve to measure contraction of the TA muscle. The data were plotted to display the prototypic force-frequency relationship, and the tetanic measurements delivered at 150 Hz were used as outcome variables. Specific force was calculated by dividing the absolute peak force measurement by the mass of the isolated muscle.
Generation of protein lysates and immunoblotting. Freshly isolated TA muscles were harvested from mice using flash-frozen liquid nitrogen. A small (~15 mg) portion of the mid-belly of the muscle was sampled for lysate generation via hand-homogenization in a modified NP-40 lysis buffer (10 mM NaH2PO4 [pH 7.2], 2 mM EDTA, 10 mM NaN3, 120 mM NaCl, 0.5% deoxycholate, 1% NP-40) supplemented with cOmplete protease inhibitor (Roche) and Halt phosphatase inhibitor (Thermo Fisher Scientific) cocktails. NuPage LDS sample buffer and reducing agent (Invitrogen) were added to 20 μg of protein lysates, boiled at 95°C for 5 minutes, and fractionated by 4%–12% SDS-PAGE. Protein was transferred to nitrocellulose membrane and blocked with 5% milk (RPI) in tris buffered saline containing 0.1% Tween 20. Blot strips were then probed with antibodies against sMyBP-C (rabbit polyclonal, SAB3501005, 1:12,000, MilliporeSigma) or GAPDH (mouse monoclonal, G8795, 1:30,000, MilliporeSigma) at 4°C overnight. Blots were subsequently incubated in the appropriate horseradish peroxidase–conjugated secondary antibody (Cell Signaling Technology) and ECL substrate (Thermo Fisher Scientific). Densitometry was performed with ImageJ software (NIH), and the average value of 2 technical replicates was used for analysis.
Single nucleotide turnover Mant-ATP assay. Biochemical assessment of the myosin relaxation states was determined using single nucleotide turnover Mant-ATP chase experiments, as previously reported (35). In short, mice were humanely euthanized via CO2 inhalation, followed by cervical dislocation. The TA muscle was quickly harvested and placed in a skinning solution of 1:1 glycerol to relaxing solution containing 4 mM Mg-ATP, 1 mM free Mg2+, 1 × 10⁻⁶ mM free Ca2+, 20 mM imidazole, 7 mM EGTA, 14.5 mM creatine phosphate, and sufficient KCl to adjust the ionic strength to 180 mM and the pH to 7.0. The tissue was pinned on Sylgard plates to maintain its resting length, incubated in relaxing solution at –20°C for 48 hours, and subsequently cryopreserved at –80°C until experimentation.
On the day of experimentation, bundles were thawed and single myofibers were mechanically isolated and mounted inside a flow chamber at a resting sarcomere length of ~2.20 μm. Fibers were incubated with rigor buffer, containing 120 mM K acetate, 5 mM Mg acetate, 2.5 mM K2HPO4, 50 mM MOPS, 2 mM DTT (pH 6.5), for 5 minutes. The flow chamber was then flushed with rigor buffer containing 250 μM Mant-ATP and allowed to incubate for 5 minutes. To complete the chase, the flow chamber was subsequently flushed with rigor buffer containing 4 mM unlabeled ATP. Florescence was acquired using a Zeiss Axio Scope A1 microscope, and 3 ROIs per myofiber were used for analysis. Normalized florescence intensity signals were fit to an unconstrained double exponential decay curve using GraphPad Prism (GraphPad Software):
 where the initial rapid decay corresponds to the DRX state and the slower second decay corresponds to the SRX state of myosin heads. P1 and P2 represent the respective amplitudes, while T1 and T2 denote the respective time constants.
Immunofluorescence combined with confocal microscopy and image processing. Mice were deeply anesthetized and perfused with 4% paraformaldehyde in PBS. The TA muscle was rapidly harvested and embedded in Tissue-Tek OCT Compound (Sakura). Cryosections (10 μm thick) were cut, permeabilized with 0.1% Triton-X in PBS for 20 minutes, and blocked with 2% goat serum, 2% BSA, and 1 mM NaN3 in PBS for 30 minutes at room temperature. Tissue sections were labeled with primary antibodies against sarcomeric α-actinin (mouse monoclonal, A7811, 1:1,000, MilliporeSigma) and sMyBP-C (rabbit polyclonal, SAB3501005, 1:250, MilliporeSigma). Samples were counterstained with the appropriate fluorophore-conjugated secondary antibody (Alexa Fluor 488 or Alexa Fluor 568, A11034 or A21043, respectively; 1:250, Thermo Fisher Scientific) along with Hoechst 33258 dye (Thermo Fisher Scientific) and subsequently mounted with ProLong Diamond Antifade Mountant (Thermo Fisher Scientific). Slides were imaged using a Nikon Ti2 inverted spinning disk confocal microscope, and images were taken at 60× magnification. Five representative ROIs from a total of 3 biological samples per sex/per genotype/per age were analyzed. Images were compiled into a z-stack, processed, and quantitatively analyzed for sarcomeric structural organization and sMyBP-C localization using FIJI software (NIH).
Quantification of sarcomeric organization and sMyBP-C localization. Tissue sections (Supplemental Figure 11, A and D) were coimmunostained for α-actinin and sMyBP-C. α-Actinin–stained images (Supplemental Figure 11, B and E) were used to calculate sarcomeric breakage, continuity, and order scores. In particular, images underwent skeletonization and branching analysis using the Skeletonize3D and AnalyzeSkeleton FIJI plugins. The number and length of branches were used to calculate the “breakage” and “continuity” scores, respectively. Moreover, α-actinin–stained images were subjected to Fast Fourier Transform (FFT) analysis (Supplemental Figure 11, G and I) to determine the sarcomeric “order” score based on the regularity of Z-disk periodicity, as previously described (54). The resulting power spectra were analyzed using a customized Python script (https://github.com/humbertojoca/FFT_peaks; commit ID bcf80aab0ea5dd5b8d57c31046a0a40cb6a6b37b) that calculated the relationship of intensity versus spatial frequency. The first peak, located at ~0.4 μm–1 on the power spectrum (Supplemental Figure 11, G and I; green arrow), and the corresponding peak in the resulting trace (Supplemental Figure 11, K and M; marked in green), reflect sarcomeric “order.” The amplitude of the first peak was reported as the “order” score.
The breakage, continuity, and order scores were then collectively used to classify the type of sarcomeric (dis)organization shown in Supplemental Figure 12, as: prototypic sarcomeric organization, characterized by a regular striated pattern (Supplemental Figure 12A); lateral misalignment, characterized by lateral dissociation of adjacent myofibrils (Supplemental Figure 12B); sarcomeric continuum, characterized by uninterrupted wavy-like striations (Supplemental Figure 12C); disordered organization, characterized by irregular and out-of-register sarcomeres in the absence of lateral breakage (Supplemental Figure 12D); and chaotic organization, characterized by irregular and out-of-register sarcomeres in the presence of lateral breakage (Supplemental Figure 12E).
The localization of sMyBP-C to the C-zone in its characteristic doublet was evaluated using 2 methods. The first method qualitatively evaluated sMyBP-C distribution along a ~10 μm ROI using FIJI. Specifically, normalized signal intensity values of α-actinin (marker of overall sarcomeric structure) and sMyBP-C were plotted versus distance along the ROI to visualize their striated localization patterns. The second method quantitatively evaluated sMyBP-C localization throughout the entire image. sMyBP-C–stained images (Supplemental Figure 11, C and F) underwent FFT analysis (Supplemental Figure 11, H and J), as described in ref. 54. The resulting power spectra were analyzed using a customized Python script (https://github.com/humbertojoca/FFT_peaks; commit ID bcf80aab0ea5dd5b8d57c31046a0a40cb6a6b37b), and the intensity versus spatial frequency was plotted. The second peak, located at ~0.8 μm–1 on the power spectrum (Supplemental Figure 11 H and J; orange arrow), and the corresponding trace (Supplemental Figure 11, L and N) reflect sMyBP-C localization to the C-zone. The amplitude of the second peak (Supplemental Figure 11, L and N) was reported as the sMyBP-C “localization” score.
Statistics. Statistical tests, sample sizes (n), and P values are provided in figure legends. Data are presented as mean ± SEM and were analyzed by GraphPad Prism. The D’Agostino & Pearson test was used to examine normality, and an F test was used to compare variances. Comparisons between 2 normal datasets of similar variance were performed using Student’s 2-tailed t test. Mann-Whitney U test or Welch’s 2-tailed t test was used for datasets that failed the normality or variance test, respectively, and a P value less than 0.05 was considered significant. Values are expressed as mean ± SEM.
Study approval. All animal work was conducted under protocols approved by the IACUC of the University of Maryland Baltimore. Studies use 6-, 12-, and 24-month-old WT and heterozygous E248K KI C57BL/6J mice from the same breeding scheme. Generation of the KI murine model was previously described in ref. 12 and contains the murine Mybpc1 E249K substitution corresponding to the human E248K variant. KI mice are referred to as the MYBPC1 E248K KI murine model to avoid confusion. The model is maintained with regular backcrossing to avoid genetic drifting and off-target effects.
Data availability. Original blots and images as well as raw data values are included in the supplemental materials and Supporting Data Values files.


