
Go to The Journal of Clinical Investigation
  • About
  • Editors
  • Consulting Editors
  • For authors
  • Journal stats
  • Publication ethics
  • Publication alerts by email
  • Transfers
  • Advertising
  • Job board
  • Contact
  • Physician-Scientist Development
  • Current issue
  • Past issues
  • By specialty
    • COVID-19
    • Cardiology
    • Immunology
    • Metabolism
    • Nephrology
    • Oncology
    • Pulmonology
    • All ...
  • Videos
  • Collections
    • In-Press Preview
    • Resource and Technical Advances
    • Clinical Research and Public Health
    • Research Letters
    • Editorials
    • Perspectives
    • Physician-Scientist Development
    • Reviews
    • Top read articles

  • Current issue
  • Past issues
  • Specialties
  • In-Press Preview
  • Resource and Technical Advances
  • Clinical Research and Public Health
  • Research Letters
  • Editorials
  • Perspectives
  • Physician-Scientist Development
  • Reviews
  • Top read articles
  • About
  • Editors
  • Consulting Editors
  • For authors
  • Journal stats
  • Publication ethics
  • Publication alerts by email
  • Transfers
  • Advertising
  • Job board
  • Contact
Top
  • View PDF
  • Download citation information
  • Send a comment
  • Terms of use
  • Standard abbreviations
  • Need help? Email the journal
  • Top
  • Abstract
  • Introduction
  • Results
  • Discussion
  • Methods
  • Author contributions
  • Conflict of interest
  • Funding support
  • Supplemental material
  • Acknowledgments
  • Footnotes
  • References
  • Version history
  • Article usage
  • Citations to this article
Advertisement

Research ArticleEndocrinologyOncology Open Access | 10.1172/jci.insight.200594

177Lu-labeled DOTA-EB-RGD as a candidate for thyroid cancer therapy

Sonam Kumari,1 Rhitajit Sarkar,1 Zhantong Wang,1 Shilpa Thakur,1 Laura Abaandou,1 Oksana Gavrilova,2 Huiyan Lu,2 Noha Behairy,1 Lixin Lang,3 Dale Kiesewetter,3 Vasyl Vasko,4 and Joanna Klubo-Gwiezdzinska1

1Metabolic Diseases Branch, National Institute of Diabetes and Digestive and Kidney Diseases,

2Mouse Metabolism Core, National Institute of Diabetes and Digestive and Kidney Diseases, and

3Molecular Tracer and Imaging Core Facility, National Institute of Biomedical Imaging and Bioengineering, NIH, Bethesda, Maryland, USA.

4Department of Pediatric Endocrinology, Uniformed Services University of the Health Sciences, Bethesda, Maryland, USA.

Address correspondence to: Joanna Klubo-Gwiezdzinska, Acting Chief of the Thyroid Tumors and Functional Thyroid Disorders Section, NIH-NIDDK, 10 Center Drive, Building 10 CRC, Room 9C-103, Bethesda, Maryland, 20814, USA. Phone: 301.496.5052; Email: joanna.klubo-gwiezdzinska@nih.gov.

Authorship note: SK and RS contributed equally to this work.

Find articles by Kumari, S. in: PubMed | Google Scholar

1Metabolic Diseases Branch, National Institute of Diabetes and Digestive and Kidney Diseases,

2Mouse Metabolism Core, National Institute of Diabetes and Digestive and Kidney Diseases, and

3Molecular Tracer and Imaging Core Facility, National Institute of Biomedical Imaging and Bioengineering, NIH, Bethesda, Maryland, USA.

4Department of Pediatric Endocrinology, Uniformed Services University of the Health Sciences, Bethesda, Maryland, USA.

Address correspondence to: Joanna Klubo-Gwiezdzinska, Acting Chief of the Thyroid Tumors and Functional Thyroid Disorders Section, NIH-NIDDK, 10 Center Drive, Building 10 CRC, Room 9C-103, Bethesda, Maryland, 20814, USA. Phone: 301.496.5052; Email: joanna.klubo-gwiezdzinska@nih.gov.

Authorship note: SK and RS contributed equally to this work.

Find articles by Sarkar, R. in: PubMed | Google Scholar

1Metabolic Diseases Branch, National Institute of Diabetes and Digestive and Kidney Diseases,

2Mouse Metabolism Core, National Institute of Diabetes and Digestive and Kidney Diseases, and

3Molecular Tracer and Imaging Core Facility, National Institute of Biomedical Imaging and Bioengineering, NIH, Bethesda, Maryland, USA.

4Department of Pediatric Endocrinology, Uniformed Services University of the Health Sciences, Bethesda, Maryland, USA.

Address correspondence to: Joanna Klubo-Gwiezdzinska, Acting Chief of the Thyroid Tumors and Functional Thyroid Disorders Section, NIH-NIDDK, 10 Center Drive, Building 10 CRC, Room 9C-103, Bethesda, Maryland, 20814, USA. Phone: 301.496.5052; Email: joanna.klubo-gwiezdzinska@nih.gov.

Authorship note: SK and RS contributed equally to this work.

Find articles by Wang, Z. in: PubMed | Google Scholar

1Metabolic Diseases Branch, National Institute of Diabetes and Digestive and Kidney Diseases,

2Mouse Metabolism Core, National Institute of Diabetes and Digestive and Kidney Diseases, and

3Molecular Tracer and Imaging Core Facility, National Institute of Biomedical Imaging and Bioengineering, NIH, Bethesda, Maryland, USA.

4Department of Pediatric Endocrinology, Uniformed Services University of the Health Sciences, Bethesda, Maryland, USA.

Address correspondence to: Joanna Klubo-Gwiezdzinska, Acting Chief of the Thyroid Tumors and Functional Thyroid Disorders Section, NIH-NIDDK, 10 Center Drive, Building 10 CRC, Room 9C-103, Bethesda, Maryland, 20814, USA. Phone: 301.496.5052; Email: joanna.klubo-gwiezdzinska@nih.gov.

Authorship note: SK and RS contributed equally to this work.

Find articles by Thakur, S. in: PubMed | Google Scholar

1Metabolic Diseases Branch, National Institute of Diabetes and Digestive and Kidney Diseases,

2Mouse Metabolism Core, National Institute of Diabetes and Digestive and Kidney Diseases, and

3Molecular Tracer and Imaging Core Facility, National Institute of Biomedical Imaging and Bioengineering, NIH, Bethesda, Maryland, USA.

4Department of Pediatric Endocrinology, Uniformed Services University of the Health Sciences, Bethesda, Maryland, USA.

Address correspondence to: Joanna Klubo-Gwiezdzinska, Acting Chief of the Thyroid Tumors and Functional Thyroid Disorders Section, NIH-NIDDK, 10 Center Drive, Building 10 CRC, Room 9C-103, Bethesda, Maryland, 20814, USA. Phone: 301.496.5052; Email: joanna.klubo-gwiezdzinska@nih.gov.

Authorship note: SK and RS contributed equally to this work.

Find articles by Abaandou, L. in: PubMed | Google Scholar

1Metabolic Diseases Branch, National Institute of Diabetes and Digestive and Kidney Diseases,

2Mouse Metabolism Core, National Institute of Diabetes and Digestive and Kidney Diseases, and

3Molecular Tracer and Imaging Core Facility, National Institute of Biomedical Imaging and Bioengineering, NIH, Bethesda, Maryland, USA.

4Department of Pediatric Endocrinology, Uniformed Services University of the Health Sciences, Bethesda, Maryland, USA.

Address correspondence to: Joanna Klubo-Gwiezdzinska, Acting Chief of the Thyroid Tumors and Functional Thyroid Disorders Section, NIH-NIDDK, 10 Center Drive, Building 10 CRC, Room 9C-103, Bethesda, Maryland, 20814, USA. Phone: 301.496.5052; Email: joanna.klubo-gwiezdzinska@nih.gov.

Authorship note: SK and RS contributed equally to this work.

Find articles by Gavrilova, O. in: PubMed | Google Scholar

1Metabolic Diseases Branch, National Institute of Diabetes and Digestive and Kidney Diseases,

2Mouse Metabolism Core, National Institute of Diabetes and Digestive and Kidney Diseases, and

3Molecular Tracer and Imaging Core Facility, National Institute of Biomedical Imaging and Bioengineering, NIH, Bethesda, Maryland, USA.

4Department of Pediatric Endocrinology, Uniformed Services University of the Health Sciences, Bethesda, Maryland, USA.

Address correspondence to: Joanna Klubo-Gwiezdzinska, Acting Chief of the Thyroid Tumors and Functional Thyroid Disorders Section, NIH-NIDDK, 10 Center Drive, Building 10 CRC, Room 9C-103, Bethesda, Maryland, 20814, USA. Phone: 301.496.5052; Email: joanna.klubo-gwiezdzinska@nih.gov.

Authorship note: SK and RS contributed equally to this work.

Find articles by Lu, H. in: PubMed | Google Scholar

1Metabolic Diseases Branch, National Institute of Diabetes and Digestive and Kidney Diseases,

2Mouse Metabolism Core, National Institute of Diabetes and Digestive and Kidney Diseases, and

3Molecular Tracer and Imaging Core Facility, National Institute of Biomedical Imaging and Bioengineering, NIH, Bethesda, Maryland, USA.

4Department of Pediatric Endocrinology, Uniformed Services University of the Health Sciences, Bethesda, Maryland, USA.

Address correspondence to: Joanna Klubo-Gwiezdzinska, Acting Chief of the Thyroid Tumors and Functional Thyroid Disorders Section, NIH-NIDDK, 10 Center Drive, Building 10 CRC, Room 9C-103, Bethesda, Maryland, 20814, USA. Phone: 301.496.5052; Email: joanna.klubo-gwiezdzinska@nih.gov.

Authorship note: SK and RS contributed equally to this work.

Find articles by Behairy, N. in: PubMed | Google Scholar

1Metabolic Diseases Branch, National Institute of Diabetes and Digestive and Kidney Diseases,

2Mouse Metabolism Core, National Institute of Diabetes and Digestive and Kidney Diseases, and

3Molecular Tracer and Imaging Core Facility, National Institute of Biomedical Imaging and Bioengineering, NIH, Bethesda, Maryland, USA.

4Department of Pediatric Endocrinology, Uniformed Services University of the Health Sciences, Bethesda, Maryland, USA.

Address correspondence to: Joanna Klubo-Gwiezdzinska, Acting Chief of the Thyroid Tumors and Functional Thyroid Disorders Section, NIH-NIDDK, 10 Center Drive, Building 10 CRC, Room 9C-103, Bethesda, Maryland, 20814, USA. Phone: 301.496.5052; Email: joanna.klubo-gwiezdzinska@nih.gov.

Authorship note: SK and RS contributed equally to this work.

Find articles by Lang, L. in: PubMed | Google Scholar

1Metabolic Diseases Branch, National Institute of Diabetes and Digestive and Kidney Diseases,

2Mouse Metabolism Core, National Institute of Diabetes and Digestive and Kidney Diseases, and

3Molecular Tracer and Imaging Core Facility, National Institute of Biomedical Imaging and Bioengineering, NIH, Bethesda, Maryland, USA.

4Department of Pediatric Endocrinology, Uniformed Services University of the Health Sciences, Bethesda, Maryland, USA.

Address correspondence to: Joanna Klubo-Gwiezdzinska, Acting Chief of the Thyroid Tumors and Functional Thyroid Disorders Section, NIH-NIDDK, 10 Center Drive, Building 10 CRC, Room 9C-103, Bethesda, Maryland, 20814, USA. Phone: 301.496.5052; Email: joanna.klubo-gwiezdzinska@nih.gov.

Authorship note: SK and RS contributed equally to this work.

Find articles by Kiesewetter, D. in: PubMed | Google Scholar

1Metabolic Diseases Branch, National Institute of Diabetes and Digestive and Kidney Diseases,

2Mouse Metabolism Core, National Institute of Diabetes and Digestive and Kidney Diseases, and

3Molecular Tracer and Imaging Core Facility, National Institute of Biomedical Imaging and Bioengineering, NIH, Bethesda, Maryland, USA.

4Department of Pediatric Endocrinology, Uniformed Services University of the Health Sciences, Bethesda, Maryland, USA.

Address correspondence to: Joanna Klubo-Gwiezdzinska, Acting Chief of the Thyroid Tumors and Functional Thyroid Disorders Section, NIH-NIDDK, 10 Center Drive, Building 10 CRC, Room 9C-103, Bethesda, Maryland, 20814, USA. Phone: 301.496.5052; Email: joanna.klubo-gwiezdzinska@nih.gov.

Authorship note: SK and RS contributed equally to this work.

Find articles by Vasko, V. in: PubMed | Google Scholar

1Metabolic Diseases Branch, National Institute of Diabetes and Digestive and Kidney Diseases,

2Mouse Metabolism Core, National Institute of Diabetes and Digestive and Kidney Diseases, and

3Molecular Tracer and Imaging Core Facility, National Institute of Biomedical Imaging and Bioengineering, NIH, Bethesda, Maryland, USA.

4Department of Pediatric Endocrinology, Uniformed Services University of the Health Sciences, Bethesda, Maryland, USA.

Address correspondence to: Joanna Klubo-Gwiezdzinska, Acting Chief of the Thyroid Tumors and Functional Thyroid Disorders Section, NIH-NIDDK, 10 Center Drive, Building 10 CRC, Room 9C-103, Bethesda, Maryland, 20814, USA. Phone: 301.496.5052; Email: joanna.klubo-gwiezdzinska@nih.gov.

Authorship note: SK and RS contributed equally to this work.

Find articles by Klubo-Gwiezdzinska, J. in: PubMed | Google Scholar |

Authorship note: SK and RS contributed equally to this work.

Published October 8, 2026 - More info

Published in Volume 11, Issue 19 on October 8, 2026
JCI Insight. 2026;11(19):e200594. https://doi.org/10.1172/jci.insight.200594.
© 2026 Kumari et al. This work is licensed under the Creative Commons Attribution 4.0 International License. To view a copy of this license, visit http://creativecommons.org/licenses/by/4.0/.
Published October 8, 2026 - Version history
Received: September 24, 2025; Accepted: August 21, 2026
View PDF
Abstract

Integrin αVβ3, a transmembrane receptor involved in tumor growth and metastasis, specifically recognizes and binds proteins with the Arg-Gly-Asp (RGD) peptide sequence. Using mRNA and/or protein expression data from 496 thyroid cancer (TC) samples in The Cancer Genome Atlas, 14 TC cell lines, and 70 TC and 10 normal thyroid tissues, we found that papillary TC exhibits the highest αVβ3 integrin expression. We then evaluated the therapeutic efficacy of a radiolabeled RGD analog, 177Lu-DOTA-EB-cRGDfK, in TC. Genetic knockout and overexpression of αVβ3 in TC cell lines confirmed the target specificity of 177Lu-DOTA-EB-cRGDfK. In mouse xenograft models established from human TC cell lines with high αVβ3 expression, 177Lu-DOTA-EB-cRGDfK demonstrated superior antitumor efficacy compared with standard-of-care lenvatinib and placebo. However, no synergistic benefit was observed with combination therapy. Biodistribution studies identified the kidneys as the dose-limiting organ. RNA-seq analysis of resected tumors demonstrated that 177Lu-DOTA-EB-cRGDfK induced a type I IFN response, characterized by upregulation of IFI6, IFIT1-2, and MX1, compared with both lenvatinib-treated tumors and placebo. These findings identify αVβ3 integrin as a promising therapeutic target in a subset of TCs and demonstrate that 177Lu-DOTA-EB-cRGDfK exhibits superior efficacy to lenvatinib, supporting its potential clinical translation for progressive TC refractory to standard therapies.

Graphical Abstract
graphical abstract
Introduction

Thyroid carcinoma (TC) is categorized by the World Health Organization into BRAF-like, RAS-like, and non-BRAF/RAS-like tumors based on its histology, differentiation, and molecular signature (1). The standard treatment for aggressive TC consists of the complete removal of thyroid gland and radioactive iodine (RAI) treatment (2). However, tumors become refractory to standard therapy in approximately 22% of patients (3, 4). Several studies have suggested that the survival rate of non–RAI-responsive TC patients is less than 3.5 years (5, 6). The use of tyrosine kinase inhibitors (TKIs), such as lenvatinib for treatment of advanced RAI refractory TC, is driven by its growth inhibitory effects elicited via multiple targets such as fibroblast growth factor receptors 1–4 (FGFR-1–4), vascular endothelial growth factor receptors 1–3 (VEGFR1–3), c-kit, RET, and platelet-derived growth factor receptor a (PDGFRa). However, therapy with TKIs leads only to transient responses (7, 8). Therefore, it is imperative to devise new therapeutic strategies to overcome these challenges.

Integrins are transmembrane receptors that can identify and bind to extracellular matrix proteins. The binding of integrins to their respective ligands leads to several structural, as well as signaling, changes in cells, including alterations in gene expression. Moreover, different levels of crosstalk exist between integrin-mediated signaling and signaling downstream of growth factors (9). A subtype of integrins (αVβ3) recognizes Arg-Gly-Asp (RGD) peptide motifs, which have a role in neovascularization and development of different cancers (10).

Radiolabeled RGD peptides are utilized as radiotracers for targeted tumor imaging and therapy. In fact, there are preliminary data revealing that the radiolabeled αVβ3 agonist 68Ga-DOTA-RGD2 could be successfully used for positron emission tomography/computed tomography (PET/CT) imaging in patients with radioiodine-refractory TC. These findings suggest that targeting αVβ3 with RGD-based ligands radiolabeled with β emitters such as lutetium-177 (177Lu) may have therapeutic potential in TC. However, given the relatively short half-life of DOTA-RGD (11, 12), we believe that the therapeutic efficacy of 177Lu-labeled RGD peptides can be improved by conjugating the Evans Blue (EB) moiety to the cyclic form of RGD peptide that extends its half-life and therapeutic efficacy (13). Therefore, the goal of this study was to assess the expression of αVβ3 in different histological and molecular subtypes of TC and to test the therapeutic efficacy of the radiolabeled integrin αVβ3 targeting agent, 177Lu-DOTA-EB-cRGDfK, in the therapy of TC in mouse xenografts.

Results

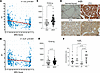
Expression of αVβ3 integrins in BRAF-like and RAS-like tumors. We utilized the publicly available database, The Cancer Genome Atlas (TCGA), consisting of mRNA expression profiles of 496 TC tissues to evaluate the association between BRAF-RAS scoring (BRS) and the expression of integrins αV and β3. We observed that there was a negative correlation between mRNA expression of αV and BRS (r = –0.5, P < 0.001) (Figure 1A). In addition, we found a low negative correlation between mRNA expression of β3 and BRS (r = –0.27, P < 0.001) (Figure 1B), suggesting that expression of αV and β3 integrins might be higher in BRAF-like tumors. Consistently with this result, RNA-seq data in selected samples harboring the BRAFV600E mutation (n = 143) and HRAS/NRAS/KRAS pathogenic variants (n = 49) showed that the expression of αV was significantly higher (P = 0.001) in BRAFV600E-driven TC as compared with RAS-driven tumors (Figure 1C), but there was no statistically significant difference in β3 expression between BRAF-like and RAS-like tumors (P = 0.07) (Figure 1D). To summarize, mRNA expression of αV is higher in BRAF-like than RAS-driven tumors, but its dimer’s partner β3 is not significantly associated with BRAF/RAS transcriptome profile. Therefore, we next focused on the analysis of αVβ3 protein dimers in TC.
Expression of αVβ3 integrins.Figure 1

Expression of αVβ3 integrins. (A) A moderate negative correlation (Spearman, 2-sided) between mRNA expression of αV and BRS (r = –0.5, P < 0.001) was observed. (B) A weak negative correlation (Spearman, 2-sided) between mRNA expression of β3 and BRS (r = –0.27, P < 0.001) (n = 496). (C) The Cancer Genome Atlas (TCGA) was utilized to evaluate the RNA-seq data in selected samples with BRAFV600E mutation (n = 143) and HRAS/NRAS/KRAS pathogenic variants (n = 49) and observed that αV expression was significantly higher (1-tailed non-parametric t test, Mann-Whitney, P = 0.001) in BRAFV600E-driven TC in comparison to RAS-driven tumors. (D) Non-significant (1-tailed non-parametric t test, Mann-Whitney) difference in β3 mRNA expression in BRAFV600E (n = 143) vs. RAS-mutant tumors (n = 49). (E) Representative immunostaining revealing a higher αVβ3 dimers expression in papillary TC (PTC) compared with follicular TC (FTC) (P = 0.03), and normal thyroid (P < 0.001). Original magnification, ×100. Scale bars: 100 μm. (F) Quantitative analysis of the immunostaining of αVβ3 dimers expression in different thyroid tissues (1-way ANOVA, Kruskal-Wallis). Normal thyroid (NT) n = 10, PTC n = 44, FTC n = 20, PDTC n = 6.

Papillary TC has higher αVβ3 expression compared with follicular TC and normal thyroid. Human tissue microarrays including 70 TC (papillary thyroid carcinoma [PTC] = 44, follicular thyroid carcinoma [FTC] = 20, poorly differentiated thyroid carcinoma [PDTC] = 6) and 10 normal thyroid samples were employed for immunohistochemistry. Higher αVβ3 expression was found in PTC compared with FTC (P = 0.03), and between PTC and normal thyroid (P < 0.001) (Figure 1, E and F). We next modeled the observed variable expression of αVβ3 in vitro in TC cell lines.

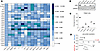
Differential expression of αVβ3 in TC cell lines. We analyzed the mRNA expression of 24 genes, including integrins αVβ3 and thyroid-specific genes (thyrotropin receptor [TSHR], thyroglobulin [TG], thyroid peroxidase [TPO], thyroid hormone receptor α [THRA], and THRB) in 13 TC cell lines and the normal thyroid cell line (HTori-3) (Figure 2A). As expected (14), TC cell lines were characterized by a significantly reduced expression of thyroid-specific genes compared with normal thyrocytes. We found a differential mRNA expression of αVβ3 integrin in TC cell lines (Figure 2A). While the mRNA level of αV (ITGAV) expression was relatively comparable between the cell lines and normal thyroid, the highest β3 (ITGB3) integrin expression was observed in TC cell lines driven by the BRAFV600E oncogenic mutation (K1, OCUT2, SW1736), MKRN1-BRAF fusion (THJ16T), or CCDC6-RET fusion (TPC1).
Comparison of αVβ3 expression.Figure 2

Comparison of αVβ3 expression. (A) Relative mRNA expression analysis of thyroid-specific genes, thyroid hormone receptor genes, and integrins in 13 TC cell lines in comparison to a normal thyrocyte cell line, HTori-3 (n = 3). TC cell lines are characterized by variable expression of ITGAV (αV) and ITGB3 (β3). (B) Immunoblot depicting the expression of αVβ3 dimers in different TC cell lines. The highest expression was found in TPC1 (CCDC6-RET fusion), followed by oncocytic TC cell line XTC1, OCUT2 (BRAF-like TC), and FTC133 (RAS-like TC). C643 (with HRAS p.G13R mutation) and THJ16T (with MKRN1-BRAF fusion) cell lines had very minimal expression of αVβ3 protein. (C) Quantification of the Western blot demonstrating αVβ3 dimer protein expression (n = 3). (D) Low non-significant correlation (Pearson, 2-tailed) between αVβ3 protein expression normalized to GAPDH (x-axis) and BRAF/RAS transcriptome profile quantified as BRAF-RAS score (BRS, y-axis): r = –0.34 (n = 3).

Relative mRNA expression patterns were confirmed at the protein level by immunoblotting and cell surface immunofluorescent staining, and 6 TC cell lines with variable αVβ3 expression were selected for further analyses. There was no statistically significant correlation between αVβ3 dimers and BRAF/RAS status of TC cell lines (r = –0.34, P = 0.51, Figure 2, B–D), despite a moderate-to-high correlation of individual monomers αV (r = –0.7, P = 0.12, Supplemental Figure 1, A–C; supplemental material available online with this article; https://doi.org/10.1172/jci.insight.200594DS1), and β3 (r = –0.61, P = 0.19, Supplemental Figure 1, D–F).

Taken together, these data suggest no association between αVβ3 dimer expression and BRAF-like or RAS-like transcriptome profile. However, we have established a preclinical model of differential αVβ3 expression in human TC.

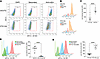
Cell surface expression of αVβ3 integrin receptors. To analyze cell surface expression of αVβ3, we performed flow cytometry on cell lines characterized by high (OCUT2) and low (FTC133) overall αVβ3 expression. The dot plots (Figure 3A) show a higher percentage of αVβ3-positive cells in OCUT2 (99.7%) than in FTC133 (63.2%), as is corroborated by the staggered overlay of the univariate histogram (Figure 3B) for the detector channel. Moreover, comparison of the mean fluorescence intensity (MFI) showed that OCUT2 is characterized by a 2.6-fold higher (P < 0.001) expression of αVβ3 on the cell surface as compared with FTC133 (Figure 3C). When ITGB3 was knocked out in OCUT2 (OCUT-β3KO), the cell surface expression of αVβ3 dimer was not detected (Figure 3D). The corresponding scatter dot plot for the MFI supported the observation, showing a 10-fold decrease to a near-negligible level of αVβ3 in OCUT-β3KO cells (P < 0.0001). On the other hand, with adenoviral overexpression of ITGAV and ITGB3 in the FTC133 cell line (FTC133-αVβ3+, Supplemental Figure 2), the αVβ3 cell surface expression increased, as shown in the staggered histogram (Figure 3E) and in the adjoining dot plot, with a 4-fold increase compared with parental FTC133 (P < 0.0001).
Evaluation of αVβ3 integrin receptor on TC cell surface.Figure 3

Evaluation of αVβ3 integrin receptor on TC cell surface. (A) Representative flow cytometry dot plots (10,000 events acquired; N = 3, n = 3) showing cell-surface expression of integrin αVβ3 in OCUT2 (99% positive, upper panel) and FTC133 (63% positive, lower panel) cells. Red gates indicate αVβ3-positive cells detected by AF633-conjugated secondary antibody fluorescence (APC channel, x-axis) versus side scatter (y-axis). Plots are shown for DAPI, secondary antibody control, and anti-αVβ3–stained cells. (B) Overlay histograms of αVβ3 staining show a greater rightward fluorescence shift in OCUT2 cells compared with FTC133 cells, indicating higher αVβ3 expression. (C) The mean fluorescence intensity (MFI) analysis revealed higher αVβ3 cell surface expression in OCUT2 than in FTC133. The results show an average of N = 4 biological replicate experiments, each done in triplicate (n = 3) and 2-tailed Welch’s t test was performed. (D) The staggered overlay for the univariate histograms of αVβ3 staining for OCUT2-β3KO (blue) over OCUT2 parental cells with secondary (green) and anti-αVβ3 (red) antibodies shows no expression of αVβ3 receptor on the knockout cell surface. The adjacent dot plot quantitatively reveals the significant downregulation in MFI (N = 4, n = 2 or 3, 2-tailed Welch’s t test). (E) Adenoviral overexpression of αVβ3 on FTC133 (red) resulted in a substantial shift of the staggered histogram compared with parental FTC133 (blue) and parental cells with secondary antibody (green). The corresponding MFI analysis showed a significant increase in αVβ3 cell surface expression in the overexpressing cells compared with the parental cells (N = 4, n = 3, 2-tailed Welch’s t test). ****P < 0.0001.

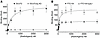
Saturation radioligand binding to αVβ3 integrin receptors. Consistently, radioligand binding assays to the αVβ3 receptors, showed a significantly higher maximum binding sites (Bmax) in OCUT2 cells as compared with FTC133 cells (mean ± SEM of 422.5 ± 49.4 and 88.1 ±13.9 fmol, respectively, P = 0.016; Figure 4, A and B), with the former having a significantly higher binding affinity (Kd) value (OCUT2 344.1 ± 57.6 nM vs. FTC133 97.4 ± 10.0 nM, P = 0.047). Accordingly, we have identified TC cell line models with high and low αVβ3 cell surface expression for testing in vivo. In order to identify the specificity of the RGD peptide to the cell surface dimer αVβ3 receptor, saturation binding of 68Ga-DOTA-RGD2 in OCUT-β3KO cells shows (Figure 4A) near-negligible affinity for the ligand (Bmax 11.3 ± 1.7 fmol) compared with the parental OCUT2 (extra-sum-of-squares F test, F(2,176) = 907.8, P < 0.0001). Saturation binding curves differed significantly between FTC133 and FTC133-αVβ3+ cells (extra-sum-of-squares F test, F(2,116)=206.6, P < 0.0001). Nonlinear regression revealed a marked increase in Bmax in FTC133-αVβ3+ cells (206.6 ± 24.5 vs. 88.1 ±13.9 fmol/mg, P < 0.0001), whereas Kd values were similar (107.1 ± 11.8 vs. 97.4 ± 10 nM, P = 0.58), as shown in Figure 4B.
68Ga-DOTA-RGD2 saturation binding assay.Figure 4

68Ga-DOTA-RGD2 saturation binding assay. The nonlinear regression curves showed saturation binding of the radioligand 68Ga-DOTA-RGD2 on (A) OCUT2 and OCUT-β3KO. OCUT-β3 KO display negligible binding compared with parental cells (mean ± SEM 11.3 ± 1.7, extra-sum-of-squares F test, F(2,176) = 907.8, P < 0.0001, N = 3, n = 3) (B) FTC133 and FTC133 αVβ3-overexpressing cells (named FTC133-αVβ3+). FTC133-αVβ3+ have markedly high binding compared with parental FTC133 (mean ± SEM 206.6 ± 24.5, extra-sum-of-squares F test, F(2,116) = 206.6, P < 0.0001, N = 2, n = 3).

Taken together, these data confirm the specificity of 68Ga-DOTA-RGD2 binding to αVβ3 integrin.

177Lu-DOTA-EB-RGD reduces tumor growth in TC tumor models with high αVβ3 integrin expression. We compared the therapeutic potential of radiolabeled RGD peptides with lenvatinib, the existing standard of care, in vivo using our established mouse models (15, 16). We selected subcutaneous and/or metastatic models with variable αVβ3 expression and binding capacity; OCUT2 served as a model with high expression and high binding capacity and FTC133 as a model with low αVβ3 expression and low Bmax. Mixed-effects model-based analysis of tumor growth velocity revealed that treatment with 177Lu-DOTA-EB-RGD (177Lu) led to a significant reduction in the tumor growth over time as compared with placebo (P < 0.001) and lenvatinib alone (P < 0.001, Figure 5A). The combination therapy (177Lu+L) resulted in decreased tumor growth compared with monotherapy with lenvatinib (P < 0.001) but had a similar effect to 177Lu monotherapy (P = 0.79) (Figure 5, A and C). In addition, PET scanning revealed that the uptake of 68Ga-DOTA-RGD2 was significantly reduced due to a smaller tumor volume in mice exposed to combination therapy (177Lu+L, maximum standard uptake value [SUVmax] 0.75 ± 0.11) as compared with treatment with placebo (SUVmax 1.12 ± 0.11; P = 0.001) as well as lenvatinib (0.98 ± 0.21; P = 0.045) (Figure 5B).

177Lu-DOTA-EB-RGD treatment in subcutaneous TC tumor models.Figure 5

177Lu-DOTA-EB-RGD treatment in subcutaneous TC tumor models. (A) Tumor growth velocity analysis by 2-way mixed-effects model ANOVA revealed that treatment with 177Lu-DOTA-EB-RGD (177Lu) led to significant tumor growth reduction over time compared with placebo (P < 0.001) and lenvatinib alone (P < 0.001). Combination therapy (177Lu+L) decreased tumor growth compared with lenvatinib monotherapy (P < 0.001), although having similar effect as 177Lu monotherapy (P = 0.79). (B) Representative PET scan images depicting uptake of 68Ga-DOTA-RGD2 in tumors showing significantly lower uptake in mice exposed to combination therapy (177Lu+L, SUVmax 0.75 ± 0.11) in comparison with the placebo group (SUVmax 1.12 ± 0.11; P = 0.001) as well as lenvatinib (0.98 ± 0.21; P = 0.045) (1-way ANOVA with Holm-Šídák multiple-comparison test). (C) Resected tumors collected from each group show that treatment with 177Lu in monotherapy or combination therapy led to a significant reduction of tumor volume (median [IQR], 2-way mixed-effects model ANOVA) with respect to placebo [P] (177Lu 0.350 cm3 [0.172–0.508] vs. P 0.928 cm3 [0.196–1.674], P = 0.0001; and 177Lu+L 0.310 cm3 [0.214–0.335] vs. P 0.928 cm3 [0.196–1.674], P < 0.0001). The combination therapy (177Lu+L, 0.337 cm3) resulted in decreased tumor volume as compared with monotherapy with lenvatinib (0.855 cm3, P = 0.05) but had a similar effect as compared with 177Lu monotherapy (P = 0.99). (D) No treatment-associated difference in 68Ga-DOTA-RGD distribution at the conclusion of the experiment in normal organs other than from higher variability in heart exposure in 177Lu monotherapy as compared with placebo (2-way ANOVA). (E) Ex vivo biodistribution studies in 177Lu monotherapy and 177Lu +L revealed that the kidneys had a similar radiation exposure to the tumors, while exposure to the heart and liver was significantly lower (2-way ANOVA). The number of mice (n) studied for each group was: placebo, n = 8; lenvatinib, L, n = 7; 177Lu, n = 8; 177Lu+L, n = 6. **P < 0.01; ***P < 0.001; ****P < 0.0001.

There was no treatment-associated difference in 68Ga-DOTA-RGD2 distribution in normal organs apart from higher variability in heart exposure in 177Lu monotherapy as compared with placebo (Figure 5D).

Ex vivo biodistribution studies in 177Lu monotherapy and 177Lu+L revealed that the kidneys had a similar radiation exposure to the tumors, while exposure to the heart (P < 0.0001) and liver (P < 0.001) was significantly lower (Figure 5E). These data suggest that kidneys might be the dose-limiting organ for bench-to-bedside translation.

RNA-seq analysis of resected tumors demonstrated that 177Lu either in monotherapy or combination therapy induced a type I IFN response, characterized by upregulation of IFN-α–inducible protein 6 (IFI6) that was the only transcript passing the false discovery rate (FDR) cutoff of q less than 0.05 (log2FC 3.5, P < 0.001, q = 0.01). Therefore, given the exploratory nature of the analysis and the limited sample size, genes with unadjusted P of less than 0.05 and |log2FC| of 1 or greater were considered candidates for further validation. Consistently, other IFN response element genes were also significantly upregulated IFN-induced protein with tetratricopeptide repeats 1 (IFIT1), IFIT2, and MX dynamin-like GTPase 1 (MX1), compared with both placebo- and lenvatinib-treated tumors (Supplemental Figure 3, A, C, and D, Supplemental Figure 4, and Supporting Data Values; unadjusted P < 0.05, and |log2FC| ≥ 1). Treatment with 177Lu was also associated with reduced expression of the proangiogenic factor vascular endothelial growth factor β (VEGFB) (Supplemental Figure 3A and Supporting Data Values), whereas lenvatinib predominantly suppressed epithelial-mesenchymal transition–associated (EMT-associated) and invasion-associated genes, including fibronectin 1 (FN1), cluster of differentiation 44 (CD44), MET protooncogene, catenin β1 (CTNNB1), and matrix metallopeptidase 2 (MMP2) (Supplemental Figure 3B and Supporting Data Values). No significant changes in αV and β3 integrin mRNA expression were observed in mice treated with 177Lu monotherapy, whereas lenvatinib monotherapy was associated with reduced expression of integrin-associated adhesion and invasion genes, including ITGAV, ITGB5, FN1, CD44, and MMP2 (Supplemental Figure 3B and Supporting Data Values). However, downstream focal adhesion signaling components, including focal adhesion kinase (FAK, encoded by PTK2), SRC protooncogene, paxillin (PXN), and vinculin (VCL), did not exhibit a significant differential expression across treatment groups. Consistently, the protein expression of αVβ3 dimers was significantly reduced in lenvatinib (3.0 ± 0.82 vs. 8.86 ± 2.27, P = 0.001) and L+177Lu combination therapy (3.5 ± 01.52 vs. 8.86 ± 2.27, P = 0.01), as compared with placebo (Figure 6). However, its decreased expression was also observed in 177Lu monotherapy (3.33 ± 0.52 vs. 8.86 ± 2.27, P = 0.01), despite no detectable changes in integrin transcript levels. This finding suggests that 177Lu treatment may have preferentially eliminated clones with high integrin expression. Furthermore, immunostaining revealed uniform FAK expression across treatment groups (Supplemental Figure 5, A and B), indicating that cell-matrix anchorage signaling was not differentially affected. Additional downstream targets of integrin signaling, pan-AKT, p-ERK1/2, and p-MEK, were also not significantly affected in any of the treatment groups. Similarly, no differential expression was found for tumor-suppressing PTEN in any of the studied groups (Supplemental Figure 5, A and B). Collectively, these findings suggest that the therapeutic activity of 177Lu-DOTA-EB-RGD is not mediated by major transcriptional downregulation of αVβ3 integrin.
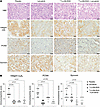
Immunohistochemistry of tumor tissues.Figure 6

Immunohistochemistry of tumor tissues. (A) Representative images of immunostaining for αVβ3 integrin, proliferation marker PCNA, and survival marker survivin (placebo n = 7, lenvatinib n = 7, 177Lu-DOTA-EB-RGD n = 6, 177Lu-DOTA-EB-RGD + lenvatinib n = 6). Original magnification, ×200. Scale bars: 100 μm. (B) Quantitative analysis of immunostaining of different groups with respect to control showing that compared to the tumors treated with placebo, the expression of integrin αVβ3 dimers (1-way ANOVA, Kruskal-Wallis) was significantly reduced in lenvatinib (P = 0.001), 177Lu monotherapy group (P = 0.01), and 177Lu+L combination therapy (P = 0.01). Proliferation marker PCNA (1-way ANOVA, Kruskal-Wallis) was significantly reduced in the tumors exposed to combination therapy with 177Lu+L (P = 0.004) and monotherapy with lenvatinib with respect to placebo (P < 0.001). Also, in comparison with the tumors treated with placebo (Welch’s t test), survivin (cancer cells’ survival marker) was found to be significantly reduced in 177Lu+L combination therapy (P = 0.03) and 177Lu monotherapy (P = 0.006).

Immunostaining for proliferation and anti-apoptotic markers (Figure 6A) revealed that compared with placebo, proliferation marker PCNA was significantly reduced in the tumors subjected to combination therapy with 177Lu+L (median score 2.5 [IQR 2–3.75] vs. 9 [IQR 6–12], P = 0.001) and monotherapy with lenvatinib (median score 2 [IQR 2–4] vs. 9 [IQR 6–12], P < 0.001), while there was a slight, statistically nonsignificant decrease in the proliferation marker with 177Lu alone as compared with placebo (median score 6 [IQR 5.25–6] vs. 9 [IQR 6–12], P = 0.47). Compared with tumors exposed to placebo, the cancer cells’ survival marker survivin was significantly reduced in 177Lu combination therapy (score 3.83 ± 2.4 vs. 7.71 ± 3.14, P = 0.03) and 177Lu monotherapy (score 2.83 ± 1.94 vs. 7.71 ± 3.14, P = 0.01) (Figure 6B). However, expression of key apoptotic regulators BAX and BCL2 (Supplemental Figure 6, A and B) maintained steady, localized cytoplasmic positivity across all cohorts, indicating that neither mono nor combination treatments significantly altered baseline proapoptotic signals compared with placebo control.

In contrast, the luciferase-tagged FTC133 induced lung metastatic mouse model, characterized by a low αvβ3 expression, did not identify metastatic lesions with 68Ga-DOTA-RGD2 PET imaging despite their presence being documented by IVIS imaging (Supplemental Figure 7A), consistent with low to no αVβ3 expression in metastatic lesions. This was associated with no reduction in tumor growth in response to 177Lu, since no significant difference in tumor burden via bioluminescent counts from the IVIS imaging studies was observed across all treatment groups compared to placebo (Supplemental Figure 7, A and B).

Taken together, these in vivo data indicate that treatment with 177Lu, either as monotherapy or in combination with lenvatinib, is effective in reducing the growth of TC characterized by high αvβ3 expression, and its effects are associated with eliciting a type I IFN signaling, increased prosurvival signaling, and reduced proliferation in vivo.
Discussion

In this study, we demonstrated that integrin αVβ3 is upregulated in a subset of TC, particularly in the most common histological type, PTC, and that 68Ga-labeled RGD can be used for PET imaging of tumors characterized by a high αVβ3 expression. While PTC is characterized by the highest αVβ3 expression, there is no association between its expression and BRAF-like or RAS-like status of TC. We next demonstrated that the radiolabeled αVβ3 analog 177Lu-DOTA-EB-RGD targets αVβ3 in TC, leading to tumor growth inhibition in models characterized by high αVβ3 expression, but not in models characterized by low αVβ3 expression. The therapeutic efficacy was associated with eliciting a type I IFN signaling, inhibition of proliferation and decreased TC cell survival, as well as with decreased αVβ3 expression in treated tumors. Decreased proliferation and diminished prosurvival markers are consistent with the growth inhibitory potency of therapy with 177Lu-DOTA-EB-RGD. Because no changes in αVβ3 were observed at the transcriptional level, and no changes in activation of its downstream targets have been observed on a protein level, the lower αVβ3 protein expression in treated tumors may reflect selective elimination of αVβ3-high tumor cells, resulting in enrichment of residual cells with lower receptor expression. In addition, reduced tumor cellularity, stromal remodeling, may also contribute to the observed decrease in protein expression.

Our preliminary transcriptomic data showing induction of IFN-stimulated genes after 177Lu-DOTA-EB-RGD are consistent with emerging evidence that 177Lu-based radiopharmaceutical therapies can activate a STING-dependent type I IFN program in tumor cells associated with an increased intratumoral CD8+/Treg ratio (17). Furthermore, 177Lu-labeled ligands targeting different protein receptors, including 177Lu-iPD-L1, have been shown to remodel the tumor immune microenvironment, enhance immune effector functions, and augment antitumor immunity (18). However, activation of IFN-stimulated genes in our model as potential mechanism of therapeutic efficacy contributing to treatment-associated immune modulation needs to be tested in an immunocompetent model.

Integrins have been targeted with radiolabeled ligands in various metastatic cancers such as gliomas and non–small cell lung cancer (NSCLC) (19–23). There are several clinical trials successfully utilizing PET/CT imaging for evaluation of αVβ3-positive cells in lymphomas, prostate, lung, breast, or head and neck cancers, as well as clinical trials focused on the selection of patients that may benefit from integrin targeting peptide receptor radionuclide therapy (PRRT) based on PET/CT imaging (e.g., ClinicalTrials.gov NCT05549024, NCT06638034, and NCT05013086) (24, 25). There are also preclinical data in breast, prostate, and pancreatic cancers utilizing αVβ3 ligands radiolabeled with α emitters (225Ac) showing a significant reduction in tumor burden (26–28). However, the application of this management strategy has not yet reached the clinical trial stage. There are also efforts to leverage integrins’ role in tumor neovascularization and combine RGD-analog-based therapy with antiangiogenic agents (24).

Interestingly, patients with metastatic TC have also been enrolled in small pilot studies focused on screening for αVβ3 integrins using PET/CT (e.g., ClinicalTrials.gov NCT05549024 and NCT06638034). Parihar et al. evaluated the diagnostic accuracy of 68Ga-DOTA-RGD2 PET/CT in patients with radioiodine-refractory TC (RAIR-TC), validating the utilization of this radiotracer in the human population (12). The authors observed a high specific uptake of radiolabeled RGDs in metastatic lesions, inferring an optimal target for 177Lu-labeled RGDs for therapy. In a follow-up study, the same group presented a case report of a safe use of 177Lu-DOTA-RGD2 in a patient with metastatic RAIR-TC that resulted in improved pain control due to a reduction in size of one of the bone lesions located in the sternum at 4 months after therapy (29). However, the duration of such a response is unknown, as there are no follow-up data available. To optimize this therapeutic approach, patient selection may need to be guided by PET/CT imaging using 68Ga- or 64Cu-labeled αVβ3 ligands to identify candidates for PRRT based on high tumor uptake. Given that our preclinical biodistribution studies identified the kidneys as the dose-limiting organ, PRRT may need to be accompanied by renoprotective amino acid infusions, similar to the standard practice used in PRRT targeting somatostatin receptors (30).

One of the limitations of RGD-based treatment is its limited stability, short half-life (24), and rapid renal clearance. Thus, it is crucial to improve its pharmacokinetics and pharmacodynamics. One strategy to overcome the drawback of low solution stability of RGD peptides is to cyclize the linear form of the RGD peptide (31, 32). Stability is enhanced by reducing conformational flexibility, leading to a lower susceptibility to proteolytic damage. Therefore, the cyclic form of RGD was used for therapy purposes, and RGD dimers for PET imaging. However, even the cyclic dimeric form has been characterized by a high Kd in our model. Therefore, in addition, in our study, cyclic RGD was chemically conjugated with an albumin-binding moiety-truncated Evans Blue (denoted as EB-RGD), leading to an increased half-life and elevated tumor uptake and tumor residence time (13, 33, 34). Zhao et al. utilized 177Lu-conjugated DOTA-EB-RGD in a preclinical model using patient-derived xenografts from subjects with advanced NSCLC (13), showing superior theranostic properties compared with non–EB-bound RGD. Another preliminary clinical study found that utilizing 177Lu-labeled dimeric RGD peptide to treat patients with TC resulted in improved biodistribution and prolonged retention in locoregional/metastatic lesions (35). Another avenue to extend the biological half-life of RGD analogs is to modify them using lipid particles. Addition of lipids like polyethylene glycol (PEG) into RGD peptides results in lower immunogenicity, as the peptide is protected from the rapid clearance by the immune system (36–38). In addition, there are efforts to embed RGD analogs into the liposomes. In order to decrease the risk of severe allergic response to liposomes, some studies have suggested that the introduction of an SGS (serine-glycine-serine) amino acid sequence in c(RGDyK)-modified liposomes may lead to reduced anaphylaxis events and improve the safety profile of drug delivery (39).

One of the strengths of our study is the utilization of the robust clinical data to evaluate the expression of αVβ3 integrins in different types of TC. Moreover, our in vivo studies used new advances in RGD analog synthesis using stable cyclic analogs either in dimeric or monomeric forms and extending their biological stability by adding the EB moiety.

One of the limitations of our study is that the mechanisms of αVβ3 expression, dimerization, and cell membrane trafficking in TC have not been investigated. However, we analyzed transcriptome and protein expression of the resected tumors and demonstrated that 177Lu-DOTA-EB-RGD induces a type I interferon response program that needs to be validated in immunocompetent model. In conclusion, the radiolabeled αVβ3 analog 177Lu-DOTA-EB-RGD has potent growth inhibitory effects in TC characterized by a high αVβ3 integrin expression that has been observed mostly in PTC. The αVβ3 integrin could potentially serve as a molecular target for therapy with radiolabeled RGD analogs in a subset of TC that are characterized by a high 68Ga-DOTA-RGD2 uptake. Because kidneys appear to be dose-limiting organ, clinical translation should be preceded by pharmacokinetic studies that evaluate the addition of nephroprotective agents to PRRT.

Methods

Sex as a biological variable. Our study examined male and female mice, and similar findings are reported for both sexes.

Expression profiling of integrin αVβ3. Integrin αVβ3 mRNA and/or protein expression was evaluated in 496 TCs included in TCGA, commercially available Human TC Tissue Microarray (TMA) slides (US Biomax Inc.), including 70 TC and 10 normal thyroid samples, and 14 TC cell lines.

BRS. BRAF-like or RAS-like expression profiles were determined through standard BRS scores ranging from –1 to 0 for BRAF-like and 0 to 1 for RAS-like TC (40). The association between BRS score and αVβ3 expression was tested by Spearman’s correlation (r).

Immunohistochemistry. Immunostaining was performed on commercially available human TC tissue microarray slides (US Biomax Inc.). Sections were dewaxed, soaked in alcohol (descending alcohol series 100%, 96%, 70%), washed in deionized water, and then microwave-treated in antigen unmasking solution (Vector Laboratories) for 10 minutes. Endogenous peroxidase activity was quenched by incubation in BLOXALL Blocking Solution (Vector Laboratories) for 10 minutes. Sections were then incubated for 20 minutes in 2.5% horse serum and then at 4°C overnight with anti–integrin αVβ3 antibody (clone EM22703, ZooMAb Rabbit Monoclonal, Sigma-Aldrich; diluted 1:100).

Immunostaining was performed using ImmPRESS Horse Anti-Rabbit IgG PLUS Polymer Kit (Vector Laboratories) as per the manufacturer’s instructions. Peroxidase staining was revealed with the ImmPact DAB peroxidase substrate kit (Vector Laboratories). Sections were counterstained with hematoxylin and mounted. The antiserum was omitted in the negative control.

The results of staining were interpreted and scored independently by 2 investigators. The evaluation of immunoreactivity scores (IHS) was carried out using ×200 magnification. Staining intensity (SI) was assessed according to a categorical scale: 0, no staining; 1, faint staining; 2, slight staining; 3, moderate staining; and 4, strong staining. The percentage of positively stained cells (PP) was assessed as the following: 0, no positive cells; 1, 0%–25% positive cells; 2, 26%–50% positive cells; 3, 51%–75% positive cells; and 4, 76%–100% positive cells. An overall IHS score was calculated by multiplying SI by PP (range of possible scores 0–16). The method for immunostaining TC tumor tissue microarrays derived from mouse xenografts used in this study is described in the Supplemental Methods.

Cell culture. Fourteen TC cell lines and 1 follicular thyroid cell line (HTori-3) were used for our study. These cell lines were either gifted by Electron Kebebew (Stanford University) or purchased from the University of Colorado Cancer Center, Sigma-Aldrich, or ATCC: FTC (FTC133); PTC (K1, BCPAP, and TPC1); medullary thyroid cancer (TT); anaplastic thyroid cancer (THJ16T, THJ29T, 8505C, OCUT2, KAT18, SW1736, and C643); and oncocytic thyroid cancer (XTC1). The cell lines were grown in the following media, based on recommended optimal conditions — HTori-3, FTC133, and K1: DMEM/F-12 (Gibco); XTC1, 8505C, OCUT2, and OCUT2-β3KO: DMEM (Gibco); TT: F12K (Gibco); TPC1, THJ16T, THJ29T, KAT-18, SW1736, BCPAP, and C643: RPMI1640 (Gibco); per the manufacturers’ instructions. All media were supplemented with 10% fetal bovine serum (R&D Systems), 10 U/mL penicillin-streptomycin (Gibco), and 0.25 μg/mL amphotericin B (Gibco). Luciferase-tagged FTC133 cell lines, designated as FTC133-Luc, were also maintained in respective media supplemented with G-418 (Geneticin) to preserve antibiotic selection of the luciferase lentivirus. The cells were authenticated by short tandem repeat analysis, and contamination was excluded via IMPACT II PCR analysis (Supporting Data Values).

RT-PCR array. For gene expression analysis, we used customized RT2 Profiler PCR Array plates manufactured by QIAGEN. The plate contained primers for 4 thyroid-specific genes: thyroid-stimulating hormone receptor (TSHR), sodium-iodine symporter (NIS), thyroglobulin (TG), thyroid peroxidase (TPO); 2 thyroid hormone receptor genes: thyroid hormone receptor α (THRA) and THRB; 18 integrin genes: integrin β1–β7 (ITGB1–ITGB7), integrin α1–α6 (ITGA1–ITGA6), integrin αV (ITGAV), integrin α2B (ITGA2B), integrin αL (ITGAL), integrin αM (ITGAM), integrin αX (ITGAX); 5 housekeeping genes: β-actin (ACTB), glyceraldehyde-3-phosphate dehydrogenase (GAPDH), β-2-microglobulin (B2M), hypoxanthine phosphoribosyltransferase 1 (HPRT1), ribosomal protein lateral stalk subunit P0 (RPLP0); 1 human genomic DNA contamination control (HGDC); 1 positive PCR control (PPC); and 1 reverse transcriptase control (RTC). The gene expression within the cDNA samples was analyzed using iQ SYBR Green Supermix (Bio-Rad) on a StepOnePlus Real-Time PCR Detection System (Applied Biosystems). The relative gene expression was normalized to the housekeeping genes and calculated using the 2–ΔΔCt method.

Immunoblotting. TC cells were lysed in M-PER (Mammalian Protein Extraction Reagent, Thermo Fisher Scientific) according to the manufacturer’s instructions. The protein concentration was calculated through the Bradford assay (DC protein assay Kit II, 5000112, Bio-Rad). The protein samples were loaded on 4%–12% SDS-PAGE gels (Novex; 40 μg/lane) and transferred to polyvinylidene difluoride (PVDF) membranes through a Trans-blot Turbo system (from Bio-Rad). The membranes were then blocked with 3% BSA diluted in PBST at room temperature for 1 hour. Next, the membranes were incubated at 4°C overnight with primary antibodies against αVβ3 dimers (1:1000; Novus Biologics, SC56-07), αV monomer (1:1000; Abcam, ab179475), β3 monomer (1:1000; Abcam, ab119992), or GAPDH (1:1,000; Invitrogen, MA5-15738) as housekeeping protein. The membranes were washed thrice with PBST and incubated further with either an anti-rabbit (1:1,000; sc-2357) or anti-mouse (1:1,000; sc-516102) secondary antibody (Santa Cruz Biotechnology) at room temperature for 1 hour. The membranes were then washed with PBST thrice and visualized through an Imaging System (Bio-Rad) using ECL (obtained from Azure Biosystems).

Generation of integrin β3–knockout cell lines (ITGB3–/–) using CRISPR/Cas9 genome editing. Guide RNAs (gRNA) targeting exon 3 (3′-GCGAGGUGAGCCCAGAGGCA-5′, 3′-UCACAGCGAGGUGAGCCCAG-5′, and 3′-UUCUCCUUCAGGUCACAGCG-5′) of the integrin β3 gene (ITGB3) were designed and synthesized by Synthego. Cas9 ribonucleoprotein (RNP) was synthesized by the UC Berkeley QB3 MacroLab. The Lipofectamine CRISPRMAX Cas9 Transfection Reagent (Thermo Fisher Scientific) was used to transfect the Cas9/gRNA complex into cells, following the manufacturer’s protocol. A 2:1 molar ratio of RNA/Cas9 was determined to be optimal. Cells were seeded 24 hours prior and transfected at 50% confluence in 24-well plates. Single cells were isolated using limiting dilutions and propagated to obtain single-cell–derived colonies. Mutations in the targeted region were determined by PCR amplification and capillary DNA sequencing. Knockout of the ITGB3 gene was confirmed at the protein level by flow cytometry.

For capillary DNA sequencing, DNA was isolated from cells using the QIAGEN DNeasy Blood and Tissue Kit, and the target region amplified by PCR with the following primer pairs: 5′-GCTGGTCTACCAGGCATCTT-3′ and 3′-CCATTCTCTTGCCCACACCT-5′; and 5′-TCAGCTTCGGTTCCAAGGAC-3′ and 3′TGGATGACGGTGTCCAGTTG-5′, using the PCR Master Mix (Thermo Fisher Scientific) following the manufacturer’s instructions. The PCR product was cleaned using the Zymo Research DNA Clean & Concentrator kit and sequenced by capillary DNA sequencing. Raw sequences were analyzed using Chromas DNA sequence analysis software (Technelysium, https://technelysium.com.au/) version 2.6.6. The alignment programs EMBOSS WATER Pairwise Sequence Alignment (EMBOSS WATER < Job Dispatcher < EMBL-EBI) and Clustal Omega Multiple Sequence Alignment (Clustal Omega < Job Dispatcher < EMBL-EBI) were employed for pairwise and multiple sequence alignments respectively.

Adenovirus for hITGAV and hITGB3 and αVβ3 overexpression. Adenoviruses expressing human ITGAV (NCBI: NM_002210.5) and ITGB3 (NCBI: NM_000212.3), genes corresponding to αV and β3 proteins, were custom-designed (Supplemental Figure 2) and procured from VectorBuilder Inc. After titration to determine transfection efficiency, 10 MOI/cell for each adenovirus was used throughout the study. Cells (2 × 10⁵) were seeded overnight and treated with desired concentration of adenovirus for 48 hours in fresh media, then harvested to isolate total RNA according to the RNeasy Mini Kit (QIAGEN, 74106). cDNA was prepared using High-Capacity cDNA Reverse Transcription Kit (Applied Biosystems, 4368813), and real-time qPCR was performed to determine overexpressed genes using the TaqMan Gene Expression Assay for hITGAV (Hs00233808_m1) and hITGB3 (Hs01001469_m1). After confirming satisfactory overexpression efficiency and time point, αVβ3 dimer protein levels were analyzed.

Cell surface staining of αVβ3. FTC133 and OCUT2 cells were analyzed for live-cell surface expression of αVβ3 using flow cytometry. Optimally maintained cells were detached with Accutase cell detachment solution (Innovative Cell Technologies, AT-104), washed with PBS followed by FACS buffer (PBS, 5% FBS, 0.1% NaN3), and 2 × 10⁵ cells were used in each sample for staining. Rabbit anti-αVβ3 monoclonal antibody (1:250; Novus Biologicals, NBP2-67557) was added to designated samples and incubated for 90 minutes. Alexa Fluor 633–conjugated (AF633-conjugated) F(ab′)2-Goat anti-Rabbit IgG (H+L) (Thermo Fisher Scientific, A-21072) secondary antibody was added at a dilution of 1:1000 after the primary antibody incubation was complete. Finally, DAPI was added as a viability marker, and flow cytometric analysis was performed with 10,000 events counted for each sample. The blank control contained only secondary antibody and DAPI. The flow cytometry results were analyzed using FlowJo v10 software (https://www.flowjo.com/flowjo10/overview), and the built-in geometric mean analysis was employed to calculate the MFI. MFI measures the fluorescence intensity of a specific cell subpopulation, normalized to cell number, to quantify that subpopulation’s contribution to the overall marker expression in the entire cell population (41).

For the comparison of the cell surface expression of αVβ3 receptor in parental OCUT2 and CRISPR/Cas9 ITGB3-knockout OCUT2 (named OCUT2-β3KO) cell lines, cells were prepared as described above and stained with mouse anti–integrin αVβ3 monoclonal antibody (1:200; Abcam, ab7166), followed by AF647-conjugated Goat anti-Mouse IgG (H+L) Cross-Adsorbed secondary antibody (Thermo Fisher Scientific, A-21235) added at a dilution of 1:1000. For the parental FTC133 cells and FTC133 cells with adenoviruses overexpressing ITGAV and ITGB3 (named FTC133-αVβ3+), cell surface αVβ3 dimer staining was done in the same way after adenoviral transfection was completed.

Synthesis of radiolabeled peptides. The radiolabeled peptides 68Ga-DOTA-c(RGDfK)2, a cyclic RGD dimer labeled with 68Ga via DOTA as a linker (named 68Ga-DOTA-RGD2), and 177Lu-DOTA-EB-cRGDfK, a cyclic RGD labeled with 177Lu via DOTA as a linker and attached to Evans Blue (EB) moiety (alias 177Lu-DOTA-EB-RGD), were synthesized following a previously described method (13, 15). Briefly, 500 μL of 68Ga elution fraction (obtained from the iThemba, South Africa, generator) in 0.6 M HCl was added to a solution of 100 μL 5 M NaOH and 500 μL 1 M HEPES (pH 7.2). This solution was then added to 20 μg (1 mg/mL in water) of in-house synthesized DOTA-c(RGDfK)2. 68Ga-DOTA-c(RGDfK)2 was obtained by incubating the reaction mixture at 85°C for 10 minutes. The reaction was diluted into 5 mL of water and passed through BondElute (C-18 100 mg, Agilent). The cartridge was washed with 10 mL of water, and the product was eluted twice with 150 μL 80% ethanol containing 1 mM HCl. The column-purified radiotracer was diluted in PBS for administration in mice. Radiochemical purity was greater than 95 %, as assayed by radio HPLC.

The 30 μL stock solution of 1.94 GBq 177LuCl3 was diluted with 0.25 mL 0.4 M sodium acetate (pH 5) and mixed with 50 μg (1 mg/mL) in-house synthesized DOTA-EB-cRGDfK (33). After a 20-minute incubation at 95°C on an orbital shaker, the 177Lu-DOTA-EB-cRGDfK reaction solution was assayed by rapid TLC on iTLC (silica on fiber glass) with 0.1 M citric acid, pH 5. The iTLC plate was assayed with a Bioscan TLC plate reader. Radiochemical purity was greater than 90%, and the reaction solution was used directly following dilution with PBS prior to injection.

Determination of maximum binding sites (Bmax) and binding affinity (Kd). Saturation binding analysis was performed to determine the αVβ3 receptor densities and radiopeptide binding affinity of cell lines (42). Parental OCUT2, OCUT2-β3KO, FTC133, and FTC133-αVβ3+ cell lines were cultured in their respective media and maintained at 60%–70% confluence. Cells were individually seeded at a density of 4–5 × 10⁴ per well in 48-well flat-bottom microplates and recuperated overnight at 37°C. The wells were designated as non-specific binding (NSB) and total binding (TB). For the FTC133-αVβ3+ cell line, cells were counted after adenoviral transfection was complete and before NSB or TB designation. Increasing concentrations of 68Ga-labeled peptide, 68Ga-DOTA-RGD2 (10–3000 nM), were added, and cells were incubated at 37°C for 60 minutes. Cold (68Ga-unlabeled) peptide at a 5× concentration relative to the highest radiolabeled peptide concentration (i.e., 15 μM) was used as a blocking solution to pretreat cells in the NSB wells. Cells were washed, the bound fractions were collected using 1.5 M NaOH, and the radioactivity was counted with a well-type automatic γ counter (2480 Wizard2, PerkinElmer). Specific binding counts were obtained by subtracting NSB counts from TB counts and converted to specifically bound radioligand (in fmol). Nonlinear regression analysis with extra-sum-of-squares F test was used to analyze data from at least 3 different experiments and calculate Kd and Bmax values using the 1-site specific binding function (Y = Bmax × X/[Kd + X], where X = radioligand concentration and Y = specific binding) in GraphPad Prism (43), and Welch’s t test was used to compare the Bmax and Kd values.

Animal studies. Mice were housed up to 5 per cage, provided ad libitum access to water and standard chow (NIH-31 formula; 5L7X, Animal Specialties and Provisions). The animal room was maintained at 22°C with 50% humidity and a 12:12-hour light/dark cycle with lights off at 6 pm. Experiments were performed with equal numbers of male and female mice ranging from 8 to 13 weeks of age, with a starting weight of 20 g or more. To generate cell-derived xenografts (CDXs), athymic nude mice (NU/J, strain 002019, The Jackson Laboratory) were injected subcutaneously with 5 × 10⁶ OCUT2 cells. Tumor growth and mouse weights were measured at regular intervals, and treatment was started when the average tumor size reached approximately 200 mm3. Along with the consideration of similar average tumor size within each group, mice were randomly assigned to maintain an equal sex ratio and body weight across groups prior to treatment initiation. The treatment groups were as follows: (a) placebo group n = 8 mice: PBS via oral gavage daily and via tail vein injection once; (b) lenvatinib group n = 8: lenvatinib 10 mg/kg via daily oral gavage and PBS via tail vein injection once; (c) 177Lu group n = 8: 0.5 mCi of 177Lu-DOTA-EB-RGD via tail vein injection and PBS via oral gavage daily; (d) 177Lu+L group n = 8: 0.5 mCi of 177Lu-DOTA-EB-RGD via tail vein injection and lenvatinib 10 mg/kg via daily oral gavage. 200 μL was the delivered volume for all treatments.

Static PET imaging for 68Ga-DOTA-RGD2 (100 μCi) was conducted 60 minutes after injection. An Inveon scanner (Siemens) was utilized to capture PET images. Thereafter, the images were analyzed using ASIPro software (Siemens) to determine regions of interest and quantify SUVs. The SUVs were further corrected with respect to the injected radioactivity dose, decay values, branching, and respective mouse weight. After the last scan, mice were euthanized and tumors, heart, liver, and kidneys were collected to perform biodistribution studies. Ex vivo quantification of relative γ radioactivity in tumors and normal organs (liver, heart, and kidneys) was performed by direct measurement using a γ counter (2480 Wizard2, PerkinElmer) 1 hour after the conclusion of the experiment. The counts per minute (CPM) readings were normalized by the weight of the tissues exposed to 177Lu that was received by 2 groups of animals (177Lu and 177Lu+L) 16 days before the conclusion of the experiment and are represented as relative values for each group.

For the generation of metastatic nodules of TC in the lungs, extremely immunodeficient mice, NOD.Cg-Prkdcscid Il2rgtm1Wjl/SzJ, commonly referred to as NSG mice, were procured from The Jackson Laboratory (strain 005557). FTC133-Luc cells (5 × 10⁵) were injected i.v. through the tail vein to generate metastatic nodules in the lungs. The presence of lung and/or bone metastases was monitored weekly by bioluminescence quantification via IVIS imaging (IVIS Lumina Series III, Revvity). Mice were intraperitoneally injected with a freshly prepared solution of D-luciferin (potassium salt, Regis Technologies, 1-360222-200, 150 mg/kg body weight) in sterile PBS and anesthetized by isoflurane inhalation before IVIS imaging was performed with automatic acquisition and luminescent exposure of 60 seconds. Regions of interest (ROIs) of the same area were marked in the captured images of the animals, and the built-in analysis function was used to determine the levels of bioluminescence in terms of total counts. IVIS imaging was performed on the days of inoculation, start of treatment, and euthanasia. Sex-unbiased randomly divided mice with similar average tumor size and/or metastatic tumor burden quantified by IVIS bioluminescence with a threshold of >104 counts, were categorized into 4 groups (n ≥ 6): (a) placebo, designated P, received vehicle only; (b) lenvatinib alone (L) received 10 mg/kg body weight lenvatinib via oral gavage; (c) 177Lu-DOTA-EB-RGD (177Lu) subjected to monotherapy with 0.5 mCi radiotherapy tracer DOTA-EB-RGD conjugated to 177Lu (t½ 6.6 days) via tail vein injection, or (d) in combination with 10 mg/kg body weight lenvatinib (177Lu+L). All the treatment groups received placebo doses complementary to other groups via i.v. or p.o. at the same rate to normalize the levels of stress in animals among groups.

RNA-seq analysis of resected tumors. Total RNA from each tumor was quantified through a NanoDrop ND-1000. The library preparation was done using 1–2 g of the total RNA. Thereafter, an Agilent 2100 Bioanalyzer was employed to verify the completed libraries and quantified through the method of absolute quantification qPCR. Next, the barcoded libraries were mixed and further denatured in NaOH to single-stranded DNA, recorded on an Illumina flow cell, then amplified in situ, followed by sequencing with an Illumina NovaSeq 6000 instrument for 150 cycles.

The quality of the sequence was assessed using the FastQC software version 0.11.7 (https://www.bioinformatics.babraham.ac.uk/projects/fastqc/). The trimmed reads (trimmed 5′, 3′-adaptor bases utilizing cutadapt 1.17 (https://cutadapt.readthedocs.io/en/stable/) were then aligned to the reference genome with the Hisat2 software version 2.1.0 (https://cutadapt.readthedocs.io/en/stable/). StringTie 1.3.3 (https://github.com/gpertea/stringtie) was used to analyze the transcript abundances in each sample and the R package Ballgown 2.10.0 (https://bioconductor.org/packages/3.22/bioc/html/ballgown.html) was used to calculate the FPKM (fragments per kilobase of exon per million mapped reads) value for gene and transcript level. Thereafter, the R package Ballgown was used in order to filter the differentially expressed transcripts and genes. Next, the assembled results were employed to predict the new genes and transcripts through comparison with the reference annotation (by StringTie and Ballgown). Furthermore, detection of alternative splicing plot and events was performed through Replicate Multivariate Analysis of Transcript Splicing (rMATS). Correlation analysis and Principal Component Analysis (PCA) were based on FPKM. Gene Ontology, Hierarchical Clustering, gene expression level, Pathway analysis, volcano plots and scatter plots were conducted using the differentially expressed genes in Python 2.7 (https://www.python.org/), R or shell environments for the graphics as well as statistical computing. The RNA-seq was performed by Arraystar Inc.

Statistics. The normal distribution of continuous data is represented as mean with standard deviation (mean ± SD) or standard error of mean (mean ± SEM), and parametric tests were used for intergroup comparisons (t test or ANOVA for more than 2 groups) as appropriate. For non-normally distributed data, non-parametric tests such as the Mann-Whitney U test or the Wilcoxon rank-sum test were used. Mixed-effects model was used to assess the differences in the tumor growth rates in the 4 groups of mice subjected to different treatment modalities, and non-linear regression modeling was used for binding assays. GraphPad Prism 10.2.3 software was utilized to analyze the data, and a P value of 0.05 or less was considered to be statistically significant.

Study approval. All animals were maintained at NIH facilities in accordance with the guidelines established by the Association for Assessment and Accreditation of Laboratory Animal Care (AALAC), and all protocols were approved by the Institutional Animal Care and Use Committee (protocol: K122-MDB-24) at the National Institute of Diabetes and Digestive and Kidney Diseases (NIDDK).

Data availability. Raw data for all the experiments performed in this study as well as next-generation sequencing data are stored in the publicly available NCBI Gene Expression Omnibus (accession number GSE343650). The analytical codes are submitted in Github (commit URL: https://github.com/sonamkumari2025/RNAseq-Volcano-Plot.git; and the ID: 8a88f17ae69d2c24031898a21fba92b8fcde78d7). All the raw data from which the plots are generated in the main and supplemental figures are submitted as a Supporting Data Values file.

Statement on use of AI. On June 3, 2026, ChatGPT v.5.5, US Department of Health Enterprise was used to conceptualize the graphical abstract and was created using BioRender. Prompt used: “Using the results summary create graphical abstract. Do not recapitulate the data, rather put schematic of take-home message.”

Author contributions

SK: conception, design, data acquisition, preparation of figures, analysis and interpretation, writing the manuscript, critical review and editing the manuscript. RS: conception, design, data acquisition, preparation of figures, analysis and interpretation, writing the manuscript, critical review and editing the manuscript. ZW: data acquisition, critical review and editing the manuscript. ST: data analysis and interpretation, critical review and editing the manuscript. LA: data acquisition, critical review and editing the manuscript. OG: data acquisition, critical review and editing the manuscript. HL: data acquisition, critical review and editing the manuscript. NB: data analysis, critical review and editing the manuscript. LL: data acquisition, critical review and editing the manuscript. DK: data acquisition, critical review and editing the manuscript. VV: data acquisition, critical review and editing the manuscript. JKG: conception, design, data interpretation, writing the manuscript, critical review and editing and finalizing the manuscript, overall supervision. VV and JKG: interpretation and scoring of immunostaining results. All authors took part in reviewing the manuscript and revising its intellectual and technical content. All authors gave approval of the version to be published and agreement to be accountable for all aspects of the work.

Conflict of interest

The authors have declared that no conflict of interest exists.

Funding support

This work is the result of NIH funding, in whole or in part, and is subject to the NIH Public Access Policy. Through acceptance of this federal funding, the NIH has been given a right to make the work publicly available in PubMed Central.

  • NIDDK Intramural Program ZIE DK 04705313.
Supplemental material

View Supplemental data

View Unedited blot and gel images

View Supporting data values

Acknowledgments

We thank Lee Weinstein for a critical review of the manuscript. The graphical abstract was created using BioRender (https://BioRender.com/rwene43). This research was supported by the Intramural Research Program of the NIDDK within the NIH. The contributions of the NIH author(s) are considered Works of the US Government. The findings and conclusions presented in this paper are those of the author(s) and do not necessarily reflect the views of the NIH or the US Department of Health and Human Services.

Address correspondence to: Joanna Klubo-Gwiezdzinska, Acting Chief of the Thyroid Tumors and Functional Thyroid Disorders Section, NIH-NIDDK, 10 Center Drive, Building 10 CRC, Room 9C-103, Bethesda, Maryland, 20814, USA. Phone: 301.496.5052; Email: joanna.klubo-gwiezdzinska@nih.gov.

Footnotes

Copyright: © 2026, Kumari et al. This is an open access article published under the terms of the Creative Commons Attribution 4.0 International License.

Reference information: JCI Insight. 2026;11(19):e200594.https://doi.org/10.1172/jci.insight.200594.

References
  1. Baloch ZW, et al. Overview of the 2022 WHO classification of thyroid neoplasms. Endocr Pathol. 2022;33(1):27–63.
    View this article via: CrossRef PubMed Google Scholar
  2. Wells SA, JrRevised American Thyroid Association guidelines for the management of medullary thyroid carcinoma. Thyroid. 2015;25(6):567–610.
    View this article via: CrossRef PubMed Google Scholar
  3. Dadu R, Cabanillas ME. Optimizing therapy for radioactive iodine-refractory differentiated thyroid cancer: current state of the art and future directions. Minerva Endocrinol. 2012;37(4):335–356.
    View this article via: PubMed Google Scholar
  4. Besic N, et al. The role of radioactive iodine in the treatment of Hürthle cell carcinoma of the thyroid. Thyroid. 2003;13(6):577–584.
    View this article via: CrossRef PubMed Google Scholar
  5. Durante C, et al. Long-term outcome of 444 patients with distant metastases from papillary and follicular thyroid carcinoma: benefits and limits of radioiodine therapy. J Clin Endocrinol Metab. 2006;91(8):2892–2899.
    View this article via: CrossRef PubMed Google Scholar
  6. Robbins RJ, et al. Real-time prognosis for metastatic thyroid carcinoma based on 2-[18F]fluoro-2-deoxy-D-glucose-positron emission tomography scanning. J Clin Endocrinol Metab. 2006;91(2):498–505.
    View this article via: CrossRef PubMed Google Scholar
  7. Cabanillas ME, Habra MA. Lenvatinib: role in thyroid cancer and other solid tumors. Cancer Treat Rev. 2016;42:47–55.
    View this article via: CrossRef PubMed Google Scholar
  8. Haugen BR, et al. 2015 American Thyroid Association Management Guidelines for Adult Patients with Thyroid Nodules and Differentiated Thyroid Cancer: The American Thyroid Association Guidelines Task Force on Thyroid Nodules and Differentiated Thyroid Cancer. Thyroid. 2016;26(1):1–133.
    View this article via: CrossRef PubMed Google Scholar
  9. Legate KR, et al. Genetic and cell biological analysis of integrin outside-in signaling. Genes Dev. 2009;23(4):397–418.
    View this article via: CrossRef PubMed Google Scholar
  10. Liu S. Radiolabeled cyclic RGD peptide bioconjugates as radiotracers targeting multiple integrins. Bioconjug Chem. 2015;26(8):1413–1438.
    View this article via: CrossRef PubMed Google Scholar
  11. Klubo-Gwiezdzinska J, Chen X. Targeting integrins with radiolabeled RGD analogues for radiotheranostics of metastatic radioactive iodine nonresponsive thyroid cancer: new avenues in personalized medicine. Thyroid. 2020;30(4):476–478.
    View this article via: CrossRef PubMed Google Scholar
  12. Parihar AS, et al. 68Ga-DOTA-RGD2 positron emission tomography/computed tomography in radioiodine refractory thyroid cancer: prospective comparison of diagnostic accuracy with 18F-FDG positron emission tomography/computed tomography and evaluation toward potential theranostics. Thyroid. 2020;30(4):557–567.
    View this article via: CrossRef PubMed Google Scholar
  13. Zhao L, et al. Targeted radionuclide therapy in patient-derived xenografts using 177Lu-EB-RGD. Mol Cancer Ther. 2020;19(10):2034–2043.
    View this article via: CrossRef PubMed Google Scholar
  14. Ros P, et al. Thyroid-specific gene expression in the multi-step process of thyroid carcinogenesis. Biochimie. 1999;81(4):389–396.
    View this article via: CrossRef PubMed Google Scholar
  15. Chen H, et al. Clinical application of radiolabeled RGD peptides for PET imaging of integrin αvβ3. Theranostics. 2016;6(1):78–92.
    View this article via: CrossRef PubMed Google Scholar
  16. Thakur S, et al. 177Lu-DOTA-EB-TATE, a radiolabeled analogue of somatostatin receptor type 2, for the imaging and treatment of thyroid cancer. Clin Cancer Res. 2021;27(5):1399–1409.
    View this article via: CrossRef PubMed Google Scholar
  17. Kerr CP, et al. The effects of clinically relevant radionuclides on the activation of an IFN1 response correlate with radionuclide half-life and linear energy transfer and influence radiopharmaceutical antitumor efficacy. Cancer Immunol Res. 2025;13(8):1190–1206.
    View this article via: CrossRef PubMed Google Scholar
  18. Luna-Gutiérrez M, et al. Lutetium-177 labeled iPD-L1 as a novel immunomodulator for cancer-targeted radiotherapy. EJNMMI Radiopharm Chem. 2025;10(1):5.
    View this article via: CrossRef PubMed Google Scholar
  19. Gaertner FC, et al. Radiolabelled RGD peptides for imaging and therapy. Eur J Nucl Med Mol Imaging. 2012;39 Suppl 1:S126–S138.
    View this article via: PubMed CrossRef Google Scholar
  20. Liu S, et al. Effect of coligands on biodistribution characteristics of ternary ligand 99mTc complexes of a HYNIC-conjugated cyclic RGDfK dimer. Bioconjug Chem. 2005;16(6):1580–1588.
    View this article via: CrossRef PubMed Google Scholar
  21. Dijkgraaf I, et al. PET imaging of αvβ3 integrin expression in tumours with 68Ga-labelled mono-, di- and tetrameric RGD peptides. Eur J Nucl Med Mol Imaging. 2011;38(1):128–137.
    View this article via: CrossRef PubMed Google Scholar
  22. Liu Z, et al. Noninvasive imaging of tumor integrin expression using (18)F-labeled RGD dimer peptide with PEG (4) linkers. Eur J Nucl Med Mol Imaging. 2009;36(8):1296–1307.
    View this article via: CrossRef PubMed Google Scholar
  23. Liu S, et al. 18F-labeled galacto and PEGylated RGD dimers for PET imaging of αvβ3 integrin expression. Mol Imaging Biol. 2010;12(5):530–538.
    View this article via: CrossRef PubMed Google Scholar
  24. Javid H, et al. RGD peptide in cancer targeting: Benefits, challenges, solutions, and possible integrin-RGD interactions. Cancer Med. 2024;13(2):e6800.
    View this article via: CrossRef PubMed Google Scholar
  25. Bhattacharyya S, Dixit M. Metallic radionuclides in the development of diagnostic and therapeutic radiopharmaceuticals. Dalton Trans. 2011;40(23):6112–6128.
    View this article via: CrossRef PubMed Google Scholar
  26. Josefsson A, et al. Evaluation of targeting αVβ3 in breast cancers using RGD peptide-based agents. Nucl Med Biol. 2024;128-129(3):108880.
    View this article via: CrossRef PubMed Google Scholar
  27. Ocampo-García B, et al. 225Ac-iPSMA-RGD for alpha-therapy dual targeting of stromal/tumor cell PSMA and integrins. Int J Mol Sci. 2023;24(23):16553.
    View this article via: CrossRef PubMed Google Scholar
  28. Yoshimoto M, et al. Long-term therapeutic effects of 225Ac-DOTA-E[c(RGDfK)]2 induced by radiosensitization via G2/M arrest in pancreatic ductal adenocarcinoma. Pharmaceutics. 2024;17(1):9.
    View this article via: CrossRef PubMed Google Scholar
  29. Parihar AS, et al. Novel use of 177Lu-DOTA-RGD2 in treatment of 68Ga-DOTA-RGD2-avid lesions in papillary thyroid cancer with TENIS. Eur J Nucl Med Mol Imaging. 2018;45(10):1836–1837.
    View this article via: CrossRef PubMed Google Scholar
  30. Strosberg J, et al. Phase 3 trial of 177Lu-Dotatate for midgut neuroendocrine tumors. N Engl J Med. 2017;376(2):125–135.
    View this article via: CrossRef PubMed Google Scholar
  31. Bogdanowich-Knipp SJ, et al. The effect of conformation on the solution stability of linear vs cyclic RGD peptides. J Pept Res. 1999;53(5):523–529.
    View this article via: CrossRef PubMed Google Scholar
  32. Bogdanowich-Knipp SJ, et al. Solution stability of linear vs cyclic RGD peptides. J Pept Res. 1999;53(5):530–541.
    View this article via: CrossRef PubMed Google Scholar
  33. Chen H, et al. Novel “add-on” molecule based on evans blue confers superior pharmacokinetics and transforms drugs to theranostic agents. J Nucl Med. 2017;58(4):590–597.
    View this article via: CrossRef PubMed Google Scholar
  34. Chen H, et al. Integrin αvβ3-targeted radionuclide therapy combined with immune checkpoint blockade immunotherapy synergistically enhances anti-tumor efficacy. Theranostics. 2019;9(25):7948–7960.
    View this article via: CrossRef PubMed Google Scholar
  35. Sood A, et al. Lu-177 labeled dimeric RGD peptide in patients with radioiodine refractory-differentiated thyroid cancer: preliminary experience. J Nucl Med. 2022;63(suppl 2):3009.
  36. Noiri M, et al. Influence of cell adhesive molecules attached onto PEG-lipid-modified fluid surfaces on cell adhesion. Colloids Surf B Biointerfaces. 2019;175:375–383.
    View this article via: CrossRef PubMed Google Scholar
  37. Wang HJ, et al. Encapsulation of photosensitizers and upconversion nanocrystals in lipid micelles for photodynamic therapy. Part Part Syst Charact. 2014;31(2):228–235.
    View this article via: CrossRef Google Scholar
  38. Kibria G, et al. Dual-ligand modification of PEGylated liposomes shows better cell selectivity and efficient gene delivery. J Control Release. 2011;153(2):141–148.
    View this article via: CrossRef PubMed Google Scholar
  39. Wang X, et al. Factors influencing the immunogenicity and immunotoxicity of cyclic RGD peptide-modified nanodrug delivery systems. Mol Pharm. 2020;17(9):3281–3290.
    View this article via: CrossRef PubMed Google Scholar
  40. Agrawal N, et al. Integrated genomic characterization of papillary thyroid carcinoma. Cell. 2014;159(3):676–690.
    View this article via: CrossRef PubMed Google Scholar
  41. Lewis RE, et al. Surface and cytoplasmic immunoglobulin expression in B-cell chronic lymphocytic leukemia (CLL). Exp Mol Pathol. 2005;79(2):146–150.
    View this article via: CrossRef PubMed Google Scholar
  42. Chen CJ, et al. 68Ga-labelled NOTA-RGD-GE11 peptide for dual integrin and EGFR-targeted tumour imaging. Nucl Med Biol. 2019;68-69(68):22–30.
    View this article via: CrossRef Google Scholar
  43. Pandey S, et al. Advancing cancer theranostics through integrin αVβ3-targeted peptidomimetic IAC: from bench to bedside. Cancer Biother Radiopharm. 2024;39(9):632–643.
    View this article via: PubMed CrossRef Google Scholar
Version history
  • Version 1 (October 8, 2026): Electronic publication

Article tools

  • View PDF
  • Download citation information
  • Send a comment
  • Terms of use
  • Standard abbreviations
  • Need help? Email the journal

Metrics

  • Article usage
  • Citations to this article

Go to

  • Top
  • Abstract
  • Introduction
  • Results
  • Discussion
  • Methods
  • Author contributions
  • Conflict of interest
  • Funding support
  • Supplemental material
  • Acknowledgments
  • Footnotes
  • References
  • Version history
Advertisement
Advertisement

Copyright © 2026 American Society for Clinical Investigation
ISSN 2379-3708

Sign up for email alerts