
Research ArticleGeneticsImmunologyOncology
Open Access |  10.1172/jci.insight.195384
Loss of tumor-infiltrating lymphocytes and poor response to immunotherapy in IDH GOF mutant melanoma
Emma Specht,1,2 Lakshmi Pakanati,1 Meng-Ju Wu,2,3,4 Russell W. Jenkins,2,3,5 Derek N. Effiom,1 Nabeel Bardeesy,2,3 Bradley E. Bernstein,6,7 Moshe Sade-Feldman,2,3 Christine G. Lian,8 Genevieve M. Boland,1,2,3 Elena Torlai Triglia,3,9 and Sonia Cohen1
1Department of Surgery, Massachusetts General Hospital, Harvard Medical School, Boston, Massachusetts, USA.
2Krantz Family Center for Cancer Research, Department of Medicine, Massachusetts General Hospital, Boston, Massachusetts, USA.
3Broad Institute of MIT and Harvard, Cambridge, Massachusetts, USA.
4Division of Gastroenterology, Department of Medicine, University of Massachusetts Chan Medical School, Worcester, Massachusetts, USA.
5Division of Medical Oncology, Massachusetts General Hospital, Boston, Massachusetts, USA.
6Department of Cancer Biology, Dana-Farber Cancer Institute, Boston, Massachusetts, USA.
7Departments of Cell Biology and
8Department of Pathology, Brigham and Women’s Hospital, Harvard Medical School, Boston, Massachusetts, USA.
9School of Biological and Behavioural Sciences, Queen Mary University of London, London, United Kingdom.
Address correspondence to: Sonia Cohen, Massachusetts General Hospital, 55 Fruit Street, Boston, Massachusetts, 02114, USA. Phone: 617.643.9474; Email: scohen22@mgh.harvard.edu.
Find articles by Specht, E. in: PubMed | Google Scholar
1Department of Surgery, Massachusetts General Hospital, Harvard Medical School, Boston, Massachusetts, USA.
2Krantz Family Center for Cancer Research, Department of Medicine, Massachusetts General Hospital, Boston, Massachusetts, USA.
3Broad Institute of MIT and Harvard, Cambridge, Massachusetts, USA.
4Division of Gastroenterology, Department of Medicine, University of Massachusetts Chan Medical School, Worcester, Massachusetts, USA.
5Division of Medical Oncology, Massachusetts General Hospital, Boston, Massachusetts, USA.
6Department of Cancer Biology, Dana-Farber Cancer Institute, Boston, Massachusetts, USA.
7Departments of Cell Biology and
8Department of Pathology, Brigham and Women’s Hospital, Harvard Medical School, Boston, Massachusetts, USA.
9School of Biological and Behavioural Sciences, Queen Mary University of London, London, United Kingdom.
Address correspondence to: Sonia Cohen, Massachusetts General Hospital, 55 Fruit Street, Boston, Massachusetts, 02114, USA. Phone: 617.643.9474; Email: scohen22@mgh.harvard.edu.
Find articles by Pakanati, L. in: PubMed | Google Scholar
1Department of Surgery, Massachusetts General Hospital, Harvard Medical School, Boston, Massachusetts, USA.
2Krantz Family Center for Cancer Research, Department of Medicine, Massachusetts General Hospital, Boston, Massachusetts, USA.
3Broad Institute of MIT and Harvard, Cambridge, Massachusetts, USA.
4Division of Gastroenterology, Department of Medicine, University of Massachusetts Chan Medical School, Worcester, Massachusetts, USA.
5Division of Medical Oncology, Massachusetts General Hospital, Boston, Massachusetts, USA.
6Department of Cancer Biology, Dana-Farber Cancer Institute, Boston, Massachusetts, USA.
7Departments of Cell Biology and
8Department of Pathology, Brigham and Women’s Hospital, Harvard Medical School, Boston, Massachusetts, USA.
9School of Biological and Behavioural Sciences, Queen Mary University of London, London, United Kingdom.
Address correspondence to: Sonia Cohen, Massachusetts General Hospital, 55 Fruit Street, Boston, Massachusetts, 02114, USA. Phone: 617.643.9474; Email: scohen22@mgh.harvard.edu.
Find articles by Wu, M. in: PubMed | Google Scholar
1Department of Surgery, Massachusetts General Hospital, Harvard Medical School, Boston, Massachusetts, USA.
2Krantz Family Center for Cancer Research, Department of Medicine, Massachusetts General Hospital, Boston, Massachusetts, USA.
3Broad Institute of MIT and Harvard, Cambridge, Massachusetts, USA.
4Division of Gastroenterology, Department of Medicine, University of Massachusetts Chan Medical School, Worcester, Massachusetts, USA.
5Division of Medical Oncology, Massachusetts General Hospital, Boston, Massachusetts, USA.
6Department of Cancer Biology, Dana-Farber Cancer Institute, Boston, Massachusetts, USA.
7Departments of Cell Biology and
8Department of Pathology, Brigham and Women’s Hospital, Harvard Medical School, Boston, Massachusetts, USA.
9School of Biological and Behavioural Sciences, Queen Mary University of London, London, United Kingdom.
Address correspondence to: Sonia Cohen, Massachusetts General Hospital, 55 Fruit Street, Boston, Massachusetts, 02114, USA. Phone: 617.643.9474; Email: scohen22@mgh.harvard.edu.
Find articles by Jenkins, R. in: PubMed | Google Scholar
1Department of Surgery, Massachusetts General Hospital, Harvard Medical School, Boston, Massachusetts, USA.
2Krantz Family Center for Cancer Research, Department of Medicine, Massachusetts General Hospital, Boston, Massachusetts, USA.
3Broad Institute of MIT and Harvard, Cambridge, Massachusetts, USA.
4Division of Gastroenterology, Department of Medicine, University of Massachusetts Chan Medical School, Worcester, Massachusetts, USA.
5Division of Medical Oncology, Massachusetts General Hospital, Boston, Massachusetts, USA.
6Department of Cancer Biology, Dana-Farber Cancer Institute, Boston, Massachusetts, USA.
7Departments of Cell Biology and
8Department of Pathology, Brigham and Women’s Hospital, Harvard Medical School, Boston, Massachusetts, USA.
9School of Biological and Behavioural Sciences, Queen Mary University of London, London, United Kingdom.
Address correspondence to: Sonia Cohen, Massachusetts General Hospital, 55 Fruit Street, Boston, Massachusetts, 02114, USA. Phone: 617.643.9474; Email: scohen22@mgh.harvard.edu.
Find articles by Effiom, D. in: PubMed | Google Scholar
1Department of Surgery, Massachusetts General Hospital, Harvard Medical School, Boston, Massachusetts, USA.
2Krantz Family Center for Cancer Research, Department of Medicine, Massachusetts General Hospital, Boston, Massachusetts, USA.
3Broad Institute of MIT and Harvard, Cambridge, Massachusetts, USA.
4Division of Gastroenterology, Department of Medicine, University of Massachusetts Chan Medical School, Worcester, Massachusetts, USA.
5Division of Medical Oncology, Massachusetts General Hospital, Boston, Massachusetts, USA.
6Department of Cancer Biology, Dana-Farber Cancer Institute, Boston, Massachusetts, USA.
7Departments of Cell Biology and
8Department of Pathology, Brigham and Women’s Hospital, Harvard Medical School, Boston, Massachusetts, USA.
9School of Biological and Behavioural Sciences, Queen Mary University of London, London, United Kingdom.
Address correspondence to: Sonia Cohen, Massachusetts General Hospital, 55 Fruit Street, Boston, Massachusetts, 02114, USA. Phone: 617.643.9474; Email: scohen22@mgh.harvard.edu.
Find articles by Bardeesy, N. in: PubMed | Google Scholar
1Department of Surgery, Massachusetts General Hospital, Harvard Medical School, Boston, Massachusetts, USA.
2Krantz Family Center for Cancer Research, Department of Medicine, Massachusetts General Hospital, Boston, Massachusetts, USA.
3Broad Institute of MIT and Harvard, Cambridge, Massachusetts, USA.
4Division of Gastroenterology, Department of Medicine, University of Massachusetts Chan Medical School, Worcester, Massachusetts, USA.
5Division of Medical Oncology, Massachusetts General Hospital, Boston, Massachusetts, USA.
6Department of Cancer Biology, Dana-Farber Cancer Institute, Boston, Massachusetts, USA.
7Departments of Cell Biology and
8Department of Pathology, Brigham and Women’s Hospital, Harvard Medical School, Boston, Massachusetts, USA.
9School of Biological and Behavioural Sciences, Queen Mary University of London, London, United Kingdom.
Address correspondence to: Sonia Cohen, Massachusetts General Hospital, 55 Fruit Street, Boston, Massachusetts, 02114, USA. Phone: 617.643.9474; Email: scohen22@mgh.harvard.edu.
Find articles by Bernstein, B. in: PubMed | Google Scholar
1Department of Surgery, Massachusetts General Hospital, Harvard Medical School, Boston, Massachusetts, USA.
2Krantz Family Center for Cancer Research, Department of Medicine, Massachusetts General Hospital, Boston, Massachusetts, USA.
3Broad Institute of MIT and Harvard, Cambridge, Massachusetts, USA.
4Division of Gastroenterology, Department of Medicine, University of Massachusetts Chan Medical School, Worcester, Massachusetts, USA.
5Division of Medical Oncology, Massachusetts General Hospital, Boston, Massachusetts, USA.
6Department of Cancer Biology, Dana-Farber Cancer Institute, Boston, Massachusetts, USA.
7Departments of Cell Biology and
8Department of Pathology, Brigham and Women’s Hospital, Harvard Medical School, Boston, Massachusetts, USA.
9School of Biological and Behavioural Sciences, Queen Mary University of London, London, United Kingdom.
Address correspondence to: Sonia Cohen, Massachusetts General Hospital, 55 Fruit Street, Boston, Massachusetts, 02114, USA. Phone: 617.643.9474; Email: scohen22@mgh.harvard.edu.
Find articles by Sade-Feldman, M. in: PubMed | Google Scholar
1Department of Surgery, Massachusetts General Hospital, Harvard Medical School, Boston, Massachusetts, USA.
2Krantz Family Center for Cancer Research, Department of Medicine, Massachusetts General Hospital, Boston, Massachusetts, USA.
3Broad Institute of MIT and Harvard, Cambridge, Massachusetts, USA.
4Division of Gastroenterology, Department of Medicine, University of Massachusetts Chan Medical School, Worcester, Massachusetts, USA.
5Division of Medical Oncology, Massachusetts General Hospital, Boston, Massachusetts, USA.
6Department of Cancer Biology, Dana-Farber Cancer Institute, Boston, Massachusetts, USA.
7Departments of Cell Biology and
8Department of Pathology, Brigham and Women’s Hospital, Harvard Medical School, Boston, Massachusetts, USA.
9School of Biological and Behavioural Sciences, Queen Mary University of London, London, United Kingdom.
Address correspondence to: Sonia Cohen, Massachusetts General Hospital, 55 Fruit Street, Boston, Massachusetts, 02114, USA. Phone: 617.643.9474; Email: scohen22@mgh.harvard.edu.
Find articles by Lian, C. in: PubMed | Google Scholar
1Department of Surgery, Massachusetts General Hospital, Harvard Medical School, Boston, Massachusetts, USA.
2Krantz Family Center for Cancer Research, Department of Medicine, Massachusetts General Hospital, Boston, Massachusetts, USA.
3Broad Institute of MIT and Harvard, Cambridge, Massachusetts, USA.
4Division of Gastroenterology, Department of Medicine, University of Massachusetts Chan Medical School, Worcester, Massachusetts, USA.
5Division of Medical Oncology, Massachusetts General Hospital, Boston, Massachusetts, USA.
6Department of Cancer Biology, Dana-Farber Cancer Institute, Boston, Massachusetts, USA.
7Departments of Cell Biology and
8Department of Pathology, Brigham and Women’s Hospital, Harvard Medical School, Boston, Massachusetts, USA.
9School of Biological and Behavioural Sciences, Queen Mary University of London, London, United Kingdom.
Address correspondence to: Sonia Cohen, Massachusetts General Hospital, 55 Fruit Street, Boston, Massachusetts, 02114, USA. Phone: 617.643.9474; Email: scohen22@mgh.harvard.edu.
Find articles by Boland, G. in: PubMed | Google Scholar
1Department of Surgery, Massachusetts General Hospital, Harvard Medical School, Boston, Massachusetts, USA.
2Krantz Family Center for Cancer Research, Department of Medicine, Massachusetts General Hospital, Boston, Massachusetts, USA.
3Broad Institute of MIT and Harvard, Cambridge, Massachusetts, USA.
4Division of Gastroenterology, Department of Medicine, University of Massachusetts Chan Medical School, Worcester, Massachusetts, USA.
5Division of Medical Oncology, Massachusetts General Hospital, Boston, Massachusetts, USA.
6Department of Cancer Biology, Dana-Farber Cancer Institute, Boston, Massachusetts, USA.
7Departments of Cell Biology and
8Department of Pathology, Brigham and Women’s Hospital, Harvard Medical School, Boston, Massachusetts, USA.
9School of Biological and Behavioural Sciences, Queen Mary University of London, London, United Kingdom.
Address correspondence to: Sonia Cohen, Massachusetts General Hospital, 55 Fruit Street, Boston, Massachusetts, 02114, USA. Phone: 617.643.9474; Email: scohen22@mgh.harvard.edu.
Find articles by Torlai Triglia, E. in: PubMed | Google Scholar
1Department of Surgery, Massachusetts General Hospital, Harvard Medical School, Boston, Massachusetts, USA.
2Krantz Family Center for Cancer Research, Department of Medicine, Massachusetts General Hospital, Boston, Massachusetts, USA.
3Broad Institute of MIT and Harvard, Cambridge, Massachusetts, USA.
4Division of Gastroenterology, Department of Medicine, University of Massachusetts Chan Medical School, Worcester, Massachusetts, USA.
5Division of Medical Oncology, Massachusetts General Hospital, Boston, Massachusetts, USA.
6Department of Cancer Biology, Dana-Farber Cancer Institute, Boston, Massachusetts, USA.
7Departments of Cell Biology and
8Department of Pathology, Brigham and Women’s Hospital, Harvard Medical School, Boston, Massachusetts, USA.
9School of Biological and Behavioural Sciences, Queen Mary University of London, London, United Kingdom.
Address correspondence to: Sonia Cohen, Massachusetts General Hospital, 55 Fruit Street, Boston, Massachusetts, 02114, USA. Phone: 617.643.9474; Email: scohen22@mgh.harvard.edu.
Find articles by Cohen, S. in: PubMed | Google Scholar
Published April 9, 2026 - More info
JCI Insight. 2026;11(11):e195384. https://doi.org/10.1172/jci.insight.195384.
© 2026 Specht et al. This work is licensed under the Creative Commons Attribution 4.0 International License. To view a copy of this license, visit http://creativecommons.org/licenses/by/4.0/.
Received: May 15, 2025; Accepted: March 24, 2026

-
Results
Individuals with IDH GOF mutant melanoma respond poorly to anti-PD1 therapy. To investigate whether IDH GOF mutation affected the clinical responses to immunotherapy in melanoma, we performed institutional retrospective chart review of 823 total patients with melanoma diagnosed between 2010 and 2023 (Supplemental Figure 1; supplemental material available online with this article; https://doi.org/10.1172/jci.insight.195384DS1). 44 total patients were identified with a IDH1 or IDH2 GOF mutation from our institutional tumor NGS genetic testing tool (8). This number represents about 6% of all patients tested, in line with published estimates of the prevalence of IDH GOF mutations in melanoma (5). Patients with IDH WT melanoma were identified by the same NGS testing and were selected to have no statistically significant differences in histopathologic and demographic features compared with the control cohort (Table 1). Of those 44 IDH GOF patients, we analyzed the 19 patients (17 patients with an IDH1 GOF, and 2 patients with an IDH2 GOF) who received first-line anti-PD1 therapy in the metastatic setting. Looking at common comutations in melanoma more broadly, the abundance of BRAF V600 in the 19 IDH GOF patients was 26.4% (Table 1) and the presence of KIT mutations was 0%. We measured 2 time points relative to the start of therapy: the date of first tumor progression after commencement of therapy and the date of death or last follow-up. The IDH GOF patients tended toward worse overall survival and progression-free survival than WT patients, especially in the first 3 years after treatment (Figure 1, A and B). Previous work defined intrinsic resistance to anti-PD1 as resistance in the first 6 months of treatment (3). Following this definition, our separation in PFS and OS at the 6-month mark suggests intrinsic resistance to anti-PD1 in IDH GOF melanoma. We also investigated differences in best clinical response to therapy, defined as the best treating-physician-determined response to therapy. We called “responders” patients who had a period of either complete or partial response following commencement of therapy. “Nonresponders” were instead patients who had progressive or stable disease as their best response. Consistent with our previous observations on survival, IDH GOF patients showed a significantly higher proportion of nonresponders in comparison to the WT cohort (Figure 1C). Taken together, these results suggested that IDH GOF mutations lead to intrinsic resistance to anti-PD1 immunotherapy.
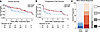 Figure 1
Intrinsic resistance to anti-PD1 therapy in patients with metastatic IDH GOF melanoma. (A and B) Kaplan-Meier survival analysis of (A) overall survival (OS) and (B) progression-free survival (PFS) of patients with melanoma treated with anti-PD1 therapy in the metastatic setting suggests worse outcomes in patients with IDH GOF mutant melanoma (blue line) compared with patients lacking the mutation (red line). This separation in progression-free survival begins before the first year of response, suggestive of intrinsic resistance (B, dotted line). (C) Comparing patients’ best response to immunotherapy (as defined by the treating clinician), mutant patients were more likely to be nonresponders (P = 0.004). Dark to light colors represent a gradient from strong to absent response. CR, complete response; PR, partial response; SD, stable disease; PD, progressive disease.
Mutant IDH tumors have decreased tumor infiltrate and more immunosuppressive T cell features compared with WT tumors. To gain insights into the possible molecular mechanism behind resistance to immunotherapy, we sought to understand the cell type composition and transcriptome of these IDH GOF tumors. Within the larger clinical cohort of patients with IDH GOF mutant melanoma, we were able to generate single-cell RNA-seq (scRNA-seq) profiles from 3 tumor samples from IDH GOF tumors and 6 matched IDH WT control tumor samples. All samples were from metastasis sites and collected before treatment. We individually matched the IDH GOF samples to control samples based on treatment setting, site, stage at time of sample, primary type, sex, and age, in that order (Supplemental Figure 2). Samples were then individually quality controlled to filter for low count genes, low count cells, ambient RNA, doublets, and debris (Methods), obtaining 71,926 high-quality cell profiles. We annotated each GEP using Leiden clustering and known marker genes (Methods, Figure 2A, and Supplemental Figure 3). The IDH GOF samples had a very different cell type composition compared with WT samples: GOF samples were composed of large tumor cell clusters with only a very small fraction of immune and epithelial clusters. Statistical testing through scCODA (9) showed that IDH GOF tumors had a significantly higher proportion of tumor cells than IDH WT samples (fibroblasts were used as a reference cell type).
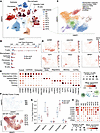 Figure 2
Single-cell RNA-seq shows a decrease in TIL in IDH GOF melanoma. Single-cell gene expression profiles from IDH GOF melanoma (n = 3 patients; 33,076 total high-quality cells; 6,566–20,786 cells per patient) were compared with profiles from well-matched IDH WT melanoma (n = 6 patients; 38,850 total high-quality cells; 4,129–10,641 per patient) in the pretreatment setting (Supplemental Figure 2). Labels M1–M3 refer to samples from IDH GOF patients. Labels WT4–WT9 refer to samples from IDH WT patients. (A) Cell gene-expression profiles (dots) were annotated by cell types (clusters) and colored by the mutational status of the tumors. Patient tumor samples were analyzed and cell types classified using Leiden clustering in conjunction with marker genes (Methods). (B) Box plot of cell type distribution in IDH GOF vs. IDH WT melanoma with dots representing individual melanomas. (A and B) Analysis with scCODA revealed that IDH GOF tumors had a larger proportion of tumor cells. (D) UMAPs representing the expression of marker genes show the normalized expression (red). (E) Dot plot showing expression of marker genes in classified T cell type groups. (D and E) Gene expression profile analysis with Hotspot on all T cells demonstrated 6 modules corresponding to T cell states. (C) Cells were assigned to their top module, and genes in each module were used to identify the modules identity (Methods). (D and E) Well-defined modules of T cell state exhibit distinctly higher expression of state-defining marker genes compared with other modules. (F) Mutant tumors had low proportions of T cells compared with WT tumors. (G) Comparing the IDH GOF and IDH WT samples, on average mutant samples included proportionally more regulatory and memory T cells and fewer CD8+ cytotoxic and exhausted T cells, representing a cold environment. (H) T cells from IDH WT tumors displayed higher expression of the CXCL13/CXCR5 signaling pathway, consistent with published work (12) understanding ICB melanoma responders.
Moreover, the IDH GOF samples were very similar to one another in terms of cell type composition, while the IDH WT samples were more heterogeneous (Figure 2B). This finding that IDH GOF tumors were primarily made up of tumor cells was supported by purity estimation in the larger TCGA cohort that found IDH GOF samples were on average more “pure” tumors (Supplemental Figure 5). Importantly, low levels of immune cells within the IDH GOF tumors may explain the lack of immunotherapy response (10).
Using Hotspot to identify groups of genes with correlated expression across single cells (11), we explored the GEP of T cells from IDH GOF and IDH WT tumors. We identified 6 GEP modules that corresponded to 5 major T cell states: regulatory, memory, cycling, cytotoxic, and exhausted. These modules were supported by both manual clustering as well as using known gene markers to perform cell expression scoring (Figure 2C and Supplemental Figure 3). We classified every cell by the GEP that it most highly used and found that, in tumors from IDH GOF patients, T cells were much more likely to have a regulatory and memory phenotype than T cells derived from IDH WT tumors (Figure 2G). Additionally, the IDH GOF tumors included fewer CD8+ cytotoxic and CD8+ exhausted cells, pointing to a relatively immunosuppressive environment in IDH GOF tumors relative to IDH WT tumors.
Previously published work found that the CXCL13/CXCR5 signaling axis between T cells and B cells distinguished responders and nonresponders to anti-PD1 therapy in melanoma (12). As increased expression of CXCL13 and INFG was found to be positively correlated with response to immunotherapy (12), we investigated the expression of these genes in IDH GOF tumors. Consistent with poor response to anti-PD1 therapy in melanoma, CXCL13 and IFNG expression was low in T cells derived from the IDH GOF tumors (Figure 2H). This suggests that IDH GOF melanoma–derived T cells are similar to T cells from other melanomas with poor response to anti-PD1.
These analyses of tumor GEPs suggest that IDH GOF melanomas have a high proportion of tumor cells (with a smaller T cell infiltrate), compared with IDH WT melanomas. Moreover, the GEPs of TILs present in IDH GOF melanoma are consistent with the poor clinical responses seen to anti-PD1 therapy in patients with IDH GOF melanoma.
Ligand-receptor interaction and spatial imaging analysis predict less active T cells in IDH TME. Our analyses of scRNA-seq show that IDH GOF tumors include a limited number of T cells, suggesting limited interactions between tumors and immune cells in these tumor types. To explore whether (and how) cells functionally interact within IDH GOF and WT tumors, we used CellphoneDB, which allowed us to characterize the number and type of interactions across cell types in IDH GOF and IDH WT melanomas (13). CellphoneDB uses a curated list of ligand-receptor pairs to analyze whether there is sufficient expression of these pairs within the samples to predict that particular ligand-receptor interaction. Our analysis revealed decreased predicted interactions between tumor cells and immune cells in IDH GOF melanomas as compared with the IDH WT melanomas (Figure 3A). These results were particularly striking for T cell/tumor interactions (25 in IDH GOF vs. 29 in IDH WT). In combination with the previous observations, these results led us to hypothesize that IDH GOF tumors are characterized by a “cold” noninteractive immune environment.
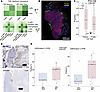 Figure 3
IDH GOF mutant tumors have decreased T cell and tumor interactions and a cold tumor environment. (A) Heatmap showing the predicted ligand-receptor interactions in each condition. Predicted ligand-receptor interactions (using CellphoneDB) were decreased in mutants, specifically in the T cell/Tumor interactions. (B) Like the single-cell data, a pretreatment tumor sample with mutant IDH from ref. 14, imaged with t-CyCIF, shows an “immune desert” with few immune cells along the edge of the tumor. Scale bars: 2,000 μm. (C) The proportions of tumor cells and T cells in this sample fell within the pattern from single-cell data. Star represents sample shown in B. (D) Representative staining of IDH WT (n = 8) and IDH GOF (n = 4) with CD8 antibody. Scale bars: 495 μm. (E) Percentage of total cells identified that were positive for CD3 or CD8 split by IDH GOF status.
To directly visualize the tumor microenvironment, we queried published spatial imaging of an IDH GOF patient (14). Examining the staining for S100 (marker for melanoma tumor cells) and CD45 (marker for leukocytes) revealed broad immune exclusion of the tumor (Figure 3B). This sample displayed a cell type composition consistent with the trend identified from single-cell data (Figure 3C), with a high density of tumor cells observed within the IDH GOF tumor. To further explore this conclusion we examined FFPE samples obtained from a complementary cohort of melanoma metastases (Methods). We found that there was a trend of fewer CD8+ T cells in IDH GOF samples (n = 4) compared with IDH WT samples (n = 8), but this was not statistically significant (Wilcoxon’s rank-sum 1-sided, P = 0.1414; Welch’s 1-sided t test, P = 0.1165) (Figure 3, D and E). The same trend was observed using CD3 as a marker of all T cells (Wilcoxon’s rank-sum 1-sided, P = 0.3414; Welch’s t test 1-sided, P = 0.4057). These trends were in line with the trend identified from single-cell data. These analyses support the conclusion that IDH GOF melanomas are characterized by a cold tumor environment.
Gene expression analysis of IDH GOF melanoma shows global transcriptional silencing. Profiling gene expression at single-cell resolution in IDH GOF and WT tumors allowed us to isolate the IDH-driven changes that are specific to tumor cells. We ran pseudobulk analysis using only the tumor cells from each single-cell sample. Pseudobulk analysis sums all cell profile gene counts from a single sample per gene so that differential gene expression between conditions can be assessed (Methods). One sample (in the IDH WT cohort) was excluded from the analysis due to low tumor cell counts (Methods). Comparing IDH GOF tumor cells with IDH WT tumor cells, we found a global pattern of gene silencing in IDH GOF tumor cells, with 586 genes significantly downregulated (log fold change [FC] < –1.5, adjusted P value [Padj] < 0.05) in IDH GOF mutants and only 106 genes upregulated (logFC > 1.5, Padj < 0.05) (Figure 4A). A pronounced downregulation of gene expression is consistent with a globally hypermethylated genome in IDH GOF tumors, as was previously suggested (5). Interestingly, this global transcriptional regulation was confined to tumor cells and was not seen when we performed a T cell–specific differential gene expression analysis (Supplemental Figure 4).
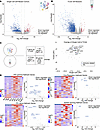 Figure 4
IDH GOF melanoma tumors are globally silenced and may promote resistance through dsDNA-mediated viral mimicry. (A) Volcano plot of the differentially expressed genes across single-cell melanoma conditions with significantly upregulated genes in red and significantly downregulated genes in blue. All labeled points refer to gene labels. For visualization purposes, 7 genes with log2FC < 0 were excluded from the volcano plot (but included in the analysis). Pseudobulk analysis of tumor cells from the single-cell samples demonstrated global gene repression. (B) Volcano plot of the differentially expressed genes across TCGA conditions with significantly upregulated genes in red and significantly downregulated genes in blue. For visualization purposes, 8 genes with log2FC < 0 were excluded from the plot (but included in the analysis). Bulk RNA-sequencing data from TCGA mirror the global gene repression. (C) 96 overlapping significantly differentially expressed genes between the single-cell and TCGA cohort were identified, many of which fell within the immune-related GO terms (blue dots). (D) Heatmap showing expression of gene sets with higher expression in red and lower expression in blue. Volcano plots show specific log2FC and adjusted P values for each gene in the set between conditions. IFN-response Hallmark Genes sets were overall downregulated in IDH pseudobulk single-cell data. Omitted for visualization purposes was MX2 at coordinate (log2FC = –8.0522, Padj = 1.02029e-19). Viral regulation and cytosolic dsDNA sensing were also downregulated in IDH GOF mutants.
To understand which groups of genes were being silenced, we performed Gene ontology (GO) term analysis on the downregulated genes identified from the tumor cell pseudobulk analysis. The top 20 enriched biological process GO terms were related to invasive cancer progression such as “angiogenesis,” “ECM organization,” and “immune modulation” (Supplemental Figure 6). We observed that 15 of the top 100 downregulated genes were related to immune regulation, including CD70, IL1B, and LTF (Supplemental Data Values). These results suggest that some of the immune consequences seen in the single-cell data may result from transcriptional changes in the IDH GOF melanoma tumor cells.
To validate these results in a larger patient cohort, we analyzed differential gene expression from TCGA skin cutaneous melanoma (SKCM) bulk RNA-seq data (5). TCGA SKCM data include 17 tumors with an IDH1 or IDH2 GOF mutation and 431 IDH WT samples. We found the same pattern of global silencing, with 2,305 genes downregulated in mutants (logFC < –1.5, Padj < 0.05) and 48 genes upregulated (logFC > 1.5, Padj < 0.05) (Figure 4B). GO term analysis found immune modulation programs within the most enriched 20 GO terms among downregulated genes (Supplemental Figure 6). These results suggested that the effects of IDH GOF mutation on immunologic gene expression programs are consistent across sampling conditions and methods.
To characterize the potential functions of the most consistently dysregulated genes in IDH GOF tumor cells, we looked at the overlap of significantly differentially expressed genes between our single-cell and TCGA bulk sequencing data (Figure 4C). This gene set included 99 differentially expressed genes shared across the single-cell tumor cells and TCGA bulk samples. The repressed gene set of 96/99 genes was downregulated in both groups, and 16% of these were related to immune pathways (Figure 4C).
Important genes such as IL1B, which has been shown to trigger inflammatory pathways, and CD70, which is part of the TNF pathway, are present in this repressed gene set (15, 16). These results together demonstrate that IDH GOF melanoma tumor cells are characterized by a highly silenced genome, resulting in downregulation of immune-related transcriptional pathways within the tumor cells themselves.
Downregulation of double-stranded DNA viral mimicry pathways in IDH GOF mutant melanoma. To understand how the IDH GOF tumor cell transcriptional state results in a melanoma with decreased T cell infiltrate, we examined the function of previously identified innate immune pathways in these cells.
Recently published work in a mouse model of IDH GOF cholangiocarcinoma suggested that transcriptional silencing of the cGAS-mediated viral mimicry response led to reduced CD8+ cytotoxic T cell recruitment (17). To see if this same mechanism is present in patients with melanoma, we explored the expression of the double-stranded DNA viral mimicry pathway in our human single-cell tumor cell data, comparing the expression of “IFN-Alpha Response Hallmark Gene Set” and “IFN-Gamma Response Hallmark Gene Set” (Figure 4D) (18). We saw that almost all genes in these sets were less expressed in IDH GOF melanoma (log2FC < 0) and all significantly differentially expressed genes were downregulated in IDH GOF melanoma (Padj < 0.05, l2FC < –1.5). For IFN-Alpha, 72/96 genes had log2FC <0 and 6 of those genes had Padj <0.05 and l2FC <–1.5. For IFN-Gamma, 150/196 genes had log2FC <0 and 11 of those genes had Padj <0.05 and l2FC <–1.5. This result suggests that downregulation of IFN signaling in IDH GOF melanoma cells may lead to decreased recruitment of T cells. The IFN response has been previously linked to the viral mimicry pathway (19). We next examined the expression of the “Viral Regulation Hallmark Gene Set” and the “Cytosolic dsDNA Sensing KEGG Gene Set” (18). For viral regulation, 40/54 genes had log2FC <0 and 4 of those genes had Padj <0.05 and l2FC <–1.5. For cytosolic dsDNA sensing, 26/57 genes had log2FC <0 and 3 of those genes had Padj <0.05 and l2FC <–1.5. This analysis showed that the majority of genes in these gene sets are less expressed in IDH GOF melanoma, and all significantly differentially expressed genes were downregulated (Figure 4D). These results suggest that the downregulation of dsDNA viral mimicry pathways, previously suggested in mouse models of IDH GOF cholangiocarcinoma, are relevant in human melanoma and provide a mechanism by which IDH GOF mutant melanoma may evade immune infiltration.
Transcriptional repression is associated with DNA methylation in IDH GOF melanoma. To understand if high levels of DNA methylation effect gene expression in IDH GOF melanoma, we analyzed the methylation status of the probes associated with the 96 genes in the repressed gene set in both single-cell and TCGA RNA-seq data (Figure 4C). Using TCGA 450K Illumina array, we calculated the differential methylation between IDH GOF and IDH WT melanoma by comparing average β values (a measure of methylation proportion of a CpG probe) at each of these genes (Methods). The majority of the repressed gene set’s genes, 67/96 genes, were more methylated in the IDH GOF melanomas compared with IDH WT tumors, suggesting that increased methylation is associated with gene silencing (Figure 5A). We then examined the methylation status of downregulated cGAS pathway gene-associated probes. This analysis demonstrated that cGAS, IRF3, and STING were on average more methylated in IDH GOF samples compared with IDH WT samples (Figure 5B). Of these, the probes associated with the cGAS gene demonstrated the greatest difference in average β value methylation between IDH GOF and IDH WT. We then queried the location within the gene of these probes and found that the hypermethylation at cGAS was particularly evident at CpG island probes, suggesting functional silencing due to disruption of transcriptional initiation (Figure 5C) (20).
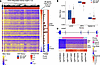 Figure 5
IDH GOF melanoma demonstrates global methylation and silencing of the cGAS pathway. (A) Heatmap of 96 repressed gene set methylation probes from TCGA averaged by gene and split by mutational status, with yellow representing more methylated and blue representing less methylated. Average difference between β values by category shown to the right, with red representing more methylated in IDH GOF and blue representing less methylated in IDH GOF. Methylation probes associated with the 96-gene signature obtained from single-cell and TCGA data (from Figure 4C) reveals that the majority are more methylated in IDH GOF samples than WT samples. (B) Box plot showing the averaged β values per gene split between conditions. (C) Testing components of the viral mimicry cGAS pathway shows higher methylation in IDH GOF samples, especially for cGAS. Heatmap of probes associated with the cGAS gene, with yellow representing most methylated and yellow representing less methylated. The differential cGAS methylation is enriched in CpG islands (in pink).


