
Research ArticleCardiologyNephrology
Open Access |  10.1172/jci.insight.179960
Proximal tubule ACE2 mediates early responses to hypertension by regulating intrarenal RAS and sodium homeostasis
Jacqueline M. Emathinger,1 Zhidan Xiang,2,3 Jonathan W. Nelson,1,4 Matthew W. Hagen,1 Nakyung Kim,4 David I. Ortiz-Melo,2 Natalie Mattocks,2 Jorge F. Giani,5 Dexter L. Lee,6 Hannah Hartman-Houstman,7 Donna L. Ralph,7 Alicia A. McDonough,7 Brianna Chen,8 Stan G. Louie,8 Thomas M. Coffman,2,9 and Susan B. Gurley1,4
1Division of Nephrology and Hypertension, Department of Medicine, Oregon Health & Science University, Portland, Oregon, USA.
2Division of Nephrology, Department of Medicine, Duke University and Durham VA Health Care Centers, Durham, North Carolina, USA.
3Department of Neurosurgery, Wake Forest School of Medicine, Winston-Salem, North Carolina, USA.
4Division of Nephrology and Hypertension, Department of Medicine, Keck School of Medicine, University of Southern California, USA.
5Department of Biomedical Sciences, Cedars-Sinai Medical Center, Los Angeles, California, USA.
6Department of Physiology and Biophysics, College of Medicine, Howard University, Washington, DC, USA.
7Department of Physiology and Neuroscience, Keck School of Medicine, and
8Clinical Pharmacy and Experimental Therapeutics Program, Alfred E. Mann School of Pharmacy and Pharmaceutical Sciences, University of Southern California, Los Angeles, California, USA.
9Program in Cardiovascular & Metabolic Disorders, Duke-NUS Medical School, Singapore.
Address correspondence to: Susan B. Gurley, Division of Nephrology and Hypertension, Department of Medicine, Keck School of Medicine of USC, 1450 San Pablo St HC4-3000, Los Angeles, California, 90033, USA. Email: susan.gurley@med.usc.edu. JME’s present address is: Department of Medicine, Santa Clara Valley Medical Center, San Jose, California, USA. MWH’s present address is: Translational Science and Therapeutics Division, Fred Hutchinson Cancer Center, Seattle, Washington, USA.
Find articles by Emathinger, J. in: PubMed | Google Scholar
1Division of Nephrology and Hypertension, Department of Medicine, Oregon Health & Science University, Portland, Oregon, USA.
2Division of Nephrology, Department of Medicine, Duke University and Durham VA Health Care Centers, Durham, North Carolina, USA.
3Department of Neurosurgery, Wake Forest School of Medicine, Winston-Salem, North Carolina, USA.
4Division of Nephrology and Hypertension, Department of Medicine, Keck School of Medicine, University of Southern California, USA.
5Department of Biomedical Sciences, Cedars-Sinai Medical Center, Los Angeles, California, USA.
6Department of Physiology and Biophysics, College of Medicine, Howard University, Washington, DC, USA.
7Department of Physiology and Neuroscience, Keck School of Medicine, and
8Clinical Pharmacy and Experimental Therapeutics Program, Alfred E. Mann School of Pharmacy and Pharmaceutical Sciences, University of Southern California, Los Angeles, California, USA.
9Program in Cardiovascular & Metabolic Disorders, Duke-NUS Medical School, Singapore.
Address correspondence to: Susan B. Gurley, Division of Nephrology and Hypertension, Department of Medicine, Keck School of Medicine of USC, 1450 San Pablo St HC4-3000, Los Angeles, California, 90033, USA. Email: susan.gurley@med.usc.edu. JME’s present address is: Department of Medicine, Santa Clara Valley Medical Center, San Jose, California, USA. MWH’s present address is: Translational Science and Therapeutics Division, Fred Hutchinson Cancer Center, Seattle, Washington, USA.
Find articles by Xiang, Z. in: PubMed | Google Scholar
1Division of Nephrology and Hypertension, Department of Medicine, Oregon Health & Science University, Portland, Oregon, USA.
2Division of Nephrology, Department of Medicine, Duke University and Durham VA Health Care Centers, Durham, North Carolina, USA.
3Department of Neurosurgery, Wake Forest School of Medicine, Winston-Salem, North Carolina, USA.
4Division of Nephrology and Hypertension, Department of Medicine, Keck School of Medicine, University of Southern California, USA.
5Department of Biomedical Sciences, Cedars-Sinai Medical Center, Los Angeles, California, USA.
6Department of Physiology and Biophysics, College of Medicine, Howard University, Washington, DC, USA.
7Department of Physiology and Neuroscience, Keck School of Medicine, and
8Clinical Pharmacy and Experimental Therapeutics Program, Alfred E. Mann School of Pharmacy and Pharmaceutical Sciences, University of Southern California, Los Angeles, California, USA.
9Program in Cardiovascular & Metabolic Disorders, Duke-NUS Medical School, Singapore.
Address correspondence to: Susan B. Gurley, Division of Nephrology and Hypertension, Department of Medicine, Keck School of Medicine of USC, 1450 San Pablo St HC4-3000, Los Angeles, California, 90033, USA. Email: susan.gurley@med.usc.edu. JME’s present address is: Department of Medicine, Santa Clara Valley Medical Center, San Jose, California, USA. MWH’s present address is: Translational Science and Therapeutics Division, Fred Hutchinson Cancer Center, Seattle, Washington, USA.
Find articles by Nelson, J. in: PubMed | Google Scholar
1Division of Nephrology and Hypertension, Department of Medicine, Oregon Health & Science University, Portland, Oregon, USA.
2Division of Nephrology, Department of Medicine, Duke University and Durham VA Health Care Centers, Durham, North Carolina, USA.
3Department of Neurosurgery, Wake Forest School of Medicine, Winston-Salem, North Carolina, USA.
4Division of Nephrology and Hypertension, Department of Medicine, Keck School of Medicine, University of Southern California, USA.
5Department of Biomedical Sciences, Cedars-Sinai Medical Center, Los Angeles, California, USA.
6Department of Physiology and Biophysics, College of Medicine, Howard University, Washington, DC, USA.
7Department of Physiology and Neuroscience, Keck School of Medicine, and
8Clinical Pharmacy and Experimental Therapeutics Program, Alfred E. Mann School of Pharmacy and Pharmaceutical Sciences, University of Southern California, Los Angeles, California, USA.
9Program in Cardiovascular & Metabolic Disorders, Duke-NUS Medical School, Singapore.
Address correspondence to: Susan B. Gurley, Division of Nephrology and Hypertension, Department of Medicine, Keck School of Medicine of USC, 1450 San Pablo St HC4-3000, Los Angeles, California, 90033, USA. Email: susan.gurley@med.usc.edu. JME’s present address is: Department of Medicine, Santa Clara Valley Medical Center, San Jose, California, USA. MWH’s present address is: Translational Science and Therapeutics Division, Fred Hutchinson Cancer Center, Seattle, Washington, USA.
Find articles by Hagen, M. in: PubMed | Google Scholar
1Division of Nephrology and Hypertension, Department of Medicine, Oregon Health & Science University, Portland, Oregon, USA.
2Division of Nephrology, Department of Medicine, Duke University and Durham VA Health Care Centers, Durham, North Carolina, USA.
3Department of Neurosurgery, Wake Forest School of Medicine, Winston-Salem, North Carolina, USA.
4Division of Nephrology and Hypertension, Department of Medicine, Keck School of Medicine, University of Southern California, USA.
5Department of Biomedical Sciences, Cedars-Sinai Medical Center, Los Angeles, California, USA.
6Department of Physiology and Biophysics, College of Medicine, Howard University, Washington, DC, USA.
7Department of Physiology and Neuroscience, Keck School of Medicine, and
8Clinical Pharmacy and Experimental Therapeutics Program, Alfred E. Mann School of Pharmacy and Pharmaceutical Sciences, University of Southern California, Los Angeles, California, USA.
9Program in Cardiovascular & Metabolic Disorders, Duke-NUS Medical School, Singapore.
Address correspondence to: Susan B. Gurley, Division of Nephrology and Hypertension, Department of Medicine, Keck School of Medicine of USC, 1450 San Pablo St HC4-3000, Los Angeles, California, 90033, USA. Email: susan.gurley@med.usc.edu. JME’s present address is: Department of Medicine, Santa Clara Valley Medical Center, San Jose, California, USA. MWH’s present address is: Translational Science and Therapeutics Division, Fred Hutchinson Cancer Center, Seattle, Washington, USA.
Find articles by Kim, N. in: PubMed | Google Scholar
1Division of Nephrology and Hypertension, Department of Medicine, Oregon Health & Science University, Portland, Oregon, USA.
2Division of Nephrology, Department of Medicine, Duke University and Durham VA Health Care Centers, Durham, North Carolina, USA.
3Department of Neurosurgery, Wake Forest School of Medicine, Winston-Salem, North Carolina, USA.
4Division of Nephrology and Hypertension, Department of Medicine, Keck School of Medicine, University of Southern California, USA.
5Department of Biomedical Sciences, Cedars-Sinai Medical Center, Los Angeles, California, USA.
6Department of Physiology and Biophysics, College of Medicine, Howard University, Washington, DC, USA.
7Department of Physiology and Neuroscience, Keck School of Medicine, and
8Clinical Pharmacy and Experimental Therapeutics Program, Alfred E. Mann School of Pharmacy and Pharmaceutical Sciences, University of Southern California, Los Angeles, California, USA.
9Program in Cardiovascular & Metabolic Disorders, Duke-NUS Medical School, Singapore.
Address correspondence to: Susan B. Gurley, Division of Nephrology and Hypertension, Department of Medicine, Keck School of Medicine of USC, 1450 San Pablo St HC4-3000, Los Angeles, California, 90033, USA. Email: susan.gurley@med.usc.edu. JME’s present address is: Department of Medicine, Santa Clara Valley Medical Center, San Jose, California, USA. MWH’s present address is: Translational Science and Therapeutics Division, Fred Hutchinson Cancer Center, Seattle, Washington, USA.
Find articles by Ortiz-Melo, D. in: PubMed | Google Scholar
1Division of Nephrology and Hypertension, Department of Medicine, Oregon Health & Science University, Portland, Oregon, USA.
2Division of Nephrology, Department of Medicine, Duke University and Durham VA Health Care Centers, Durham, North Carolina, USA.
3Department of Neurosurgery, Wake Forest School of Medicine, Winston-Salem, North Carolina, USA.
4Division of Nephrology and Hypertension, Department of Medicine, Keck School of Medicine, University of Southern California, USA.
5Department of Biomedical Sciences, Cedars-Sinai Medical Center, Los Angeles, California, USA.
6Department of Physiology and Biophysics, College of Medicine, Howard University, Washington, DC, USA.
7Department of Physiology and Neuroscience, Keck School of Medicine, and
8Clinical Pharmacy and Experimental Therapeutics Program, Alfred E. Mann School of Pharmacy and Pharmaceutical Sciences, University of Southern California, Los Angeles, California, USA.
9Program in Cardiovascular & Metabolic Disorders, Duke-NUS Medical School, Singapore.
Address correspondence to: Susan B. Gurley, Division of Nephrology and Hypertension, Department of Medicine, Keck School of Medicine of USC, 1450 San Pablo St HC4-3000, Los Angeles, California, 90033, USA. Email: susan.gurley@med.usc.edu. JME’s present address is: Department of Medicine, Santa Clara Valley Medical Center, San Jose, California, USA. MWH’s present address is: Translational Science and Therapeutics Division, Fred Hutchinson Cancer Center, Seattle, Washington, USA.
Find articles by Mattocks, N. in: PubMed | Google Scholar
1Division of Nephrology and Hypertension, Department of Medicine, Oregon Health & Science University, Portland, Oregon, USA.
2Division of Nephrology, Department of Medicine, Duke University and Durham VA Health Care Centers, Durham, North Carolina, USA.
3Department of Neurosurgery, Wake Forest School of Medicine, Winston-Salem, North Carolina, USA.
4Division of Nephrology and Hypertension, Department of Medicine, Keck School of Medicine, University of Southern California, USA.
5Department of Biomedical Sciences, Cedars-Sinai Medical Center, Los Angeles, California, USA.
6Department of Physiology and Biophysics, College of Medicine, Howard University, Washington, DC, USA.
7Department of Physiology and Neuroscience, Keck School of Medicine, and
8Clinical Pharmacy and Experimental Therapeutics Program, Alfred E. Mann School of Pharmacy and Pharmaceutical Sciences, University of Southern California, Los Angeles, California, USA.
9Program in Cardiovascular & Metabolic Disorders, Duke-NUS Medical School, Singapore.
Address correspondence to: Susan B. Gurley, Division of Nephrology and Hypertension, Department of Medicine, Keck School of Medicine of USC, 1450 San Pablo St HC4-3000, Los Angeles, California, 90033, USA. Email: susan.gurley@med.usc.edu. JME’s present address is: Department of Medicine, Santa Clara Valley Medical Center, San Jose, California, USA. MWH’s present address is: Translational Science and Therapeutics Division, Fred Hutchinson Cancer Center, Seattle, Washington, USA.
Find articles by
Giani, J.
in:
PubMed
|
Google Scholar
|

1Division of Nephrology and Hypertension, Department of Medicine, Oregon Health & Science University, Portland, Oregon, USA.
2Division of Nephrology, Department of Medicine, Duke University and Durham VA Health Care Centers, Durham, North Carolina, USA.
3Department of Neurosurgery, Wake Forest School of Medicine, Winston-Salem, North Carolina, USA.
4Division of Nephrology and Hypertension, Department of Medicine, Keck School of Medicine, University of Southern California, USA.
5Department of Biomedical Sciences, Cedars-Sinai Medical Center, Los Angeles, California, USA.
6Department of Physiology and Biophysics, College of Medicine, Howard University, Washington, DC, USA.
7Department of Physiology and Neuroscience, Keck School of Medicine, and
8Clinical Pharmacy and Experimental Therapeutics Program, Alfred E. Mann School of Pharmacy and Pharmaceutical Sciences, University of Southern California, Los Angeles, California, USA.
9Program in Cardiovascular & Metabolic Disorders, Duke-NUS Medical School, Singapore.
Address correspondence to: Susan B. Gurley, Division of Nephrology and Hypertension, Department of Medicine, Keck School of Medicine of USC, 1450 San Pablo St HC4-3000, Los Angeles, California, 90033, USA. Email: susan.gurley@med.usc.edu. JME’s present address is: Department of Medicine, Santa Clara Valley Medical Center, San Jose, California, USA. MWH’s present address is: Translational Science and Therapeutics Division, Fred Hutchinson Cancer Center, Seattle, Washington, USA.
Find articles by Lee, D. in: PubMed | Google Scholar
1Division of Nephrology and Hypertension, Department of Medicine, Oregon Health & Science University, Portland, Oregon, USA.
2Division of Nephrology, Department of Medicine, Duke University and Durham VA Health Care Centers, Durham, North Carolina, USA.
3Department of Neurosurgery, Wake Forest School of Medicine, Winston-Salem, North Carolina, USA.
4Division of Nephrology and Hypertension, Department of Medicine, Keck School of Medicine, University of Southern California, USA.
5Department of Biomedical Sciences, Cedars-Sinai Medical Center, Los Angeles, California, USA.
6Department of Physiology and Biophysics, College of Medicine, Howard University, Washington, DC, USA.
7Department of Physiology and Neuroscience, Keck School of Medicine, and
8Clinical Pharmacy and Experimental Therapeutics Program, Alfred E. Mann School of Pharmacy and Pharmaceutical Sciences, University of Southern California, Los Angeles, California, USA.
9Program in Cardiovascular & Metabolic Disorders, Duke-NUS Medical School, Singapore.
Address correspondence to: Susan B. Gurley, Division of Nephrology and Hypertension, Department of Medicine, Keck School of Medicine of USC, 1450 San Pablo St HC4-3000, Los Angeles, California, 90033, USA. Email: susan.gurley@med.usc.edu. JME’s present address is: Department of Medicine, Santa Clara Valley Medical Center, San Jose, California, USA. MWH’s present address is: Translational Science and Therapeutics Division, Fred Hutchinson Cancer Center, Seattle, Washington, USA.
Find articles by Hartman-Houstman, H. in: PubMed | Google Scholar
1Division of Nephrology and Hypertension, Department of Medicine, Oregon Health & Science University, Portland, Oregon, USA.
2Division of Nephrology, Department of Medicine, Duke University and Durham VA Health Care Centers, Durham, North Carolina, USA.
3Department of Neurosurgery, Wake Forest School of Medicine, Winston-Salem, North Carolina, USA.
4Division of Nephrology and Hypertension, Department of Medicine, Keck School of Medicine, University of Southern California, USA.
5Department of Biomedical Sciences, Cedars-Sinai Medical Center, Los Angeles, California, USA.
6Department of Physiology and Biophysics, College of Medicine, Howard University, Washington, DC, USA.
7Department of Physiology and Neuroscience, Keck School of Medicine, and
8Clinical Pharmacy and Experimental Therapeutics Program, Alfred E. Mann School of Pharmacy and Pharmaceutical Sciences, University of Southern California, Los Angeles, California, USA.
9Program in Cardiovascular & Metabolic Disorders, Duke-NUS Medical School, Singapore.
Address correspondence to: Susan B. Gurley, Division of Nephrology and Hypertension, Department of Medicine, Keck School of Medicine of USC, 1450 San Pablo St HC4-3000, Los Angeles, California, 90033, USA. Email: susan.gurley@med.usc.edu. JME’s present address is: Department of Medicine, Santa Clara Valley Medical Center, San Jose, California, USA. MWH’s present address is: Translational Science and Therapeutics Division, Fred Hutchinson Cancer Center, Seattle, Washington, USA.
Find articles by Ralph, D. in: PubMed | Google Scholar
1Division of Nephrology and Hypertension, Department of Medicine, Oregon Health & Science University, Portland, Oregon, USA.
2Division of Nephrology, Department of Medicine, Duke University and Durham VA Health Care Centers, Durham, North Carolina, USA.
3Department of Neurosurgery, Wake Forest School of Medicine, Winston-Salem, North Carolina, USA.
4Division of Nephrology and Hypertension, Department of Medicine, Keck School of Medicine, University of Southern California, USA.
5Department of Biomedical Sciences, Cedars-Sinai Medical Center, Los Angeles, California, USA.
6Department of Physiology and Biophysics, College of Medicine, Howard University, Washington, DC, USA.
7Department of Physiology and Neuroscience, Keck School of Medicine, and
8Clinical Pharmacy and Experimental Therapeutics Program, Alfred E. Mann School of Pharmacy and Pharmaceutical Sciences, University of Southern California, Los Angeles, California, USA.
9Program in Cardiovascular & Metabolic Disorders, Duke-NUS Medical School, Singapore.
Address correspondence to: Susan B. Gurley, Division of Nephrology and Hypertension, Department of Medicine, Keck School of Medicine of USC, 1450 San Pablo St HC4-3000, Los Angeles, California, 90033, USA. Email: susan.gurley@med.usc.edu. JME’s present address is: Department of Medicine, Santa Clara Valley Medical Center, San Jose, California, USA. MWH’s present address is: Translational Science and Therapeutics Division, Fred Hutchinson Cancer Center, Seattle, Washington, USA.
Find articles by McDonough, A. in: PubMed | Google Scholar
1Division of Nephrology and Hypertension, Department of Medicine, Oregon Health & Science University, Portland, Oregon, USA.
2Division of Nephrology, Department of Medicine, Duke University and Durham VA Health Care Centers, Durham, North Carolina, USA.
3Department of Neurosurgery, Wake Forest School of Medicine, Winston-Salem, North Carolina, USA.
4Division of Nephrology and Hypertension, Department of Medicine, Keck School of Medicine, University of Southern California, USA.
5Department of Biomedical Sciences, Cedars-Sinai Medical Center, Los Angeles, California, USA.
6Department of Physiology and Biophysics, College of Medicine, Howard University, Washington, DC, USA.
7Department of Physiology and Neuroscience, Keck School of Medicine, and
8Clinical Pharmacy and Experimental Therapeutics Program, Alfred E. Mann School of Pharmacy and Pharmaceutical Sciences, University of Southern California, Los Angeles, California, USA.
9Program in Cardiovascular & Metabolic Disorders, Duke-NUS Medical School, Singapore.
Address correspondence to: Susan B. Gurley, Division of Nephrology and Hypertension, Department of Medicine, Keck School of Medicine of USC, 1450 San Pablo St HC4-3000, Los Angeles, California, 90033, USA. Email: susan.gurley@med.usc.edu. JME’s present address is: Department of Medicine, Santa Clara Valley Medical Center, San Jose, California, USA. MWH’s present address is: Translational Science and Therapeutics Division, Fred Hutchinson Cancer Center, Seattle, Washington, USA.
Find articles by Chen, B. in: PubMed | Google Scholar
1Division of Nephrology and Hypertension, Department of Medicine, Oregon Health & Science University, Portland, Oregon, USA.
2Division of Nephrology, Department of Medicine, Duke University and Durham VA Health Care Centers, Durham, North Carolina, USA.
3Department of Neurosurgery, Wake Forest School of Medicine, Winston-Salem, North Carolina, USA.
4Division of Nephrology and Hypertension, Department of Medicine, Keck School of Medicine, University of Southern California, USA.
5Department of Biomedical Sciences, Cedars-Sinai Medical Center, Los Angeles, California, USA.
6Department of Physiology and Biophysics, College of Medicine, Howard University, Washington, DC, USA.
7Department of Physiology and Neuroscience, Keck School of Medicine, and
8Clinical Pharmacy and Experimental Therapeutics Program, Alfred E. Mann School of Pharmacy and Pharmaceutical Sciences, University of Southern California, Los Angeles, California, USA.
9Program in Cardiovascular & Metabolic Disorders, Duke-NUS Medical School, Singapore.
Address correspondence to: Susan B. Gurley, Division of Nephrology and Hypertension, Department of Medicine, Keck School of Medicine of USC, 1450 San Pablo St HC4-3000, Los Angeles, California, 90033, USA. Email: susan.gurley@med.usc.edu. JME’s present address is: Department of Medicine, Santa Clara Valley Medical Center, San Jose, California, USA. MWH’s present address is: Translational Science and Therapeutics Division, Fred Hutchinson Cancer Center, Seattle, Washington, USA.
Find articles by Louie, S. in: PubMed | Google Scholar
1Division of Nephrology and Hypertension, Department of Medicine, Oregon Health & Science University, Portland, Oregon, USA.
2Division of Nephrology, Department of Medicine, Duke University and Durham VA Health Care Centers, Durham, North Carolina, USA.
3Department of Neurosurgery, Wake Forest School of Medicine, Winston-Salem, North Carolina, USA.
4Division of Nephrology and Hypertension, Department of Medicine, Keck School of Medicine, University of Southern California, USA.
5Department of Biomedical Sciences, Cedars-Sinai Medical Center, Los Angeles, California, USA.
6Department of Physiology and Biophysics, College of Medicine, Howard University, Washington, DC, USA.
7Department of Physiology and Neuroscience, Keck School of Medicine, and
8Clinical Pharmacy and Experimental Therapeutics Program, Alfred E. Mann School of Pharmacy and Pharmaceutical Sciences, University of Southern California, Los Angeles, California, USA.
9Program in Cardiovascular & Metabolic Disorders, Duke-NUS Medical School, Singapore.
Address correspondence to: Susan B. Gurley, Division of Nephrology and Hypertension, Department of Medicine, Keck School of Medicine of USC, 1450 San Pablo St HC4-3000, Los Angeles, California, 90033, USA. Email: susan.gurley@med.usc.edu. JME’s present address is: Department of Medicine, Santa Clara Valley Medical Center, San Jose, California, USA. MWH’s present address is: Translational Science and Therapeutics Division, Fred Hutchinson Cancer Center, Seattle, Washington, USA.
Find articles by Coffman, T. in: PubMed | Google Scholar
1Division of Nephrology and Hypertension, Department of Medicine, Oregon Health & Science University, Portland, Oregon, USA.
2Division of Nephrology, Department of Medicine, Duke University and Durham VA Health Care Centers, Durham, North Carolina, USA.
3Department of Neurosurgery, Wake Forest School of Medicine, Winston-Salem, North Carolina, USA.
4Division of Nephrology and Hypertension, Department of Medicine, Keck School of Medicine, University of Southern California, USA.
5Department of Biomedical Sciences, Cedars-Sinai Medical Center, Los Angeles, California, USA.
6Department of Physiology and Biophysics, College of Medicine, Howard University, Washington, DC, USA.
7Department of Physiology and Neuroscience, Keck School of Medicine, and
8Clinical Pharmacy and Experimental Therapeutics Program, Alfred E. Mann School of Pharmacy and Pharmaceutical Sciences, University of Southern California, Los Angeles, California, USA.
9Program in Cardiovascular & Metabolic Disorders, Duke-NUS Medical School, Singapore.
Address correspondence to: Susan B. Gurley, Division of Nephrology and Hypertension, Department of Medicine, Keck School of Medicine of USC, 1450 San Pablo St HC4-3000, Los Angeles, California, 90033, USA. Email: susan.gurley@med.usc.edu. JME’s present address is: Department of Medicine, Santa Clara Valley Medical Center, San Jose, California, USA. MWH’s present address is: Translational Science and Therapeutics Division, Fred Hutchinson Cancer Center, Seattle, Washington, USA.
Find articles by Gurley, S. in: PubMed | Google Scholar
Published September 22, 2026 - More info
JCI Insight. 2026;11(18):e179960. https://doi.org/10.1172/jci.insight.179960.
© 2026 Emathinger et al. This work is licensed under the Creative Commons Attribution 4.0 International License. To view a copy of this license, visit http://creativecommons.org/licenses/by/4.0/.
Received: February 12, 2024; Accepted: August 5, 2026

-
Results
PT-specific deletion of ACE2. Mice lacking ACE2 specifically in the renal PT (PT ACE2–KO mice) were generated by crossing mice expressing Cre-recombinase under a modified PEPCK promoter (5, 35) with mice bearing a conditional “floxed” Ace2 allele previously generated by our laboratory (Figure 1A) (36). We verified specificity of gene deletion in the cell-specific deletion model compared with littermate Control mice bearing only the conditional allele, and we found significant loss of ACE2 expression in both the renal cortex and medulla of PT ACE2–KO mice by qPCR (Figure 1B), immunoblotting (Figure 1C), and ACE2 enzymatic activity assay (Figure 1D). To confirm cell specificity of reductions in ACE2 expression, we employed immunofluorescence and compared kidney sections from PT ACE2–KO, Control, and global ACE2-KO mice (Figure 1, E–G), including costaining with lotus tetragonolobus lectin (LTL), a PT-specific marker. Despite robust genetic deletion, PT ACE2–KO mice appeared healthy with expected gene transmission rates. As both targeted genes are on the X chromosome, only male mice aged 8–26 weeks were used in this study.
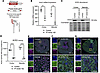 Figure 1
Proximal tubule-specific deletion of ACE2. (A) PT ACE2–KO mice were generated by crossing mice expressing Cre-recombinase downstream of the PEPCK promoter with ACE2-floxed mice. (B–D) Ace2 mRNA expression, ACE2 protein abundance and Coomassie brilliant blue loading control, and ACE2 activity in kidney cortex and medulla of PT ACE2–KO and Control mice. (E) IHC for ACE2 in the proximal tubule in Control kidneys. (F) ACE2 expression is decreased in PT ACE2–KO mice (representative images; n = 3 mice per group). (G) ACE2 is absent in Global KO mice. Hoechst DNA stain in blue, Lotus Tetragonolobus Lectin (LTL) proximal tubule marker in green, and ACE2 in magenta. Scale bar: 200 μm. Numeric data expressed as mean ± SEM and analyzed as a 2-way ANOVA with Šídák’s multiple-comparison post hoc analysis. n = 3 mice per group, **P < 0.01, ****P < 0.0001.
PT-derived ACE2 attenuates early hypertension and cardiac hypertrophy. We evaluated the effect of PT ACE2 deletion on BP regulation using continuous radiotelemetry. Baseline BPs were similar between Control and PT ACE2–KO mice except at day –1, where PT ACE2–KO mice had higher BP (117.5 ± 6.4 mmHg versus 113.0 ± 5.2 mmHg, P < 0.05). BPs increased significantly during AngII infusion in both groups. However, by day 3 of continuous AngII infusion PT ACE2–KO mice had significantly higher mean arterial pressures (MAPs) relative to Control, peaking at day 5 (159.3 ± 18.7 mmHg in PT ACE2–KO versus 142.3 ± 17.6 mmHg in Control, P = 0.01; Figure 2A, Figure 3A, and Table 1). To evaluate the effect of enhanced hypertension in PT ACE2–KO mice, we assessed the cardiac hypertrophic response to AngII, using heart weight normalized to tibia length (HW/TL). Measurement of HW/TL is optimal for evaluation of cardiac hypertrophy in mice, as it is not affected by variability in animal weight during the experimental period (37). Corresponding to the increased MAPs at day 5, HW/TL was elevated in both groups but was significantly higher in PT ACE2–KO mice (10.13 ± 1.1 mg/mm versus 9.09 ± 1.2 mg/mm, P = 0.004; Figure 2, B and C). Echocardiography measurements of left ventricular (LV) mass corroborated the increase in heart weight in both groups, with a significant difference in LV mass seen between PT ACE2-KO and Control mice after 7 days of AngII treatment (130.3 ± 13.2 mg in PT ACE2–KO and 119.1 ± 7.2 mg in Control, P = 0.048; Figure 2D). Loss of ACE2 from the PT alone is sufficient to increase susceptibility to hypertension and cardiac hypertrophy early during AngII infusion.
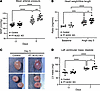 Figure 2
Proximal tubule ACE2 attenuates early hypertension and cardiac hypertrophy. (A) Mean arterial pressures (MAP) at baseline (day –3) and with continuous AngII infusion (1,000 ng/kg/min) at day 5. Day 5 MAP values are also presented in Figure 3A. (B) Ratio of heart weight to tibia length (HW/TL) in mice at baseline and treated with AngII for 5 days (n = 5–6 for baseline groups; n = 19–23 for AngII treated groups; figure displays aggregated data across multiple experiments). (C) Representative anterior-view and mid-ventricular cross-sections of hearts from Control and PT ACE2–KO mice after 5 days of AngII treatment (n = 8–10 mice per group). (D) Echocardiographic calculated left ventricular (LV) mass at diastole (n = 8–10 mice per group). Data expressed as mean ± SEM. MAP and HW/TL data were analyzed using a 2-way ANOVA with Tukey’s multiple-comparisons post hoc analysis. Echocardiography data was analyzed by mixed-effects analysis with Fisher’s LSD pairwise comparison post hoc analysis. *P < 0.05, **P < 0.01, ***P < 0.001, ****P < 0.0001.
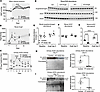 Figure 3
Proximal tubule ACE2 stabilizes response to AngII by mitigating increases in intrarenal RAS activity. (A) Mean arterial pressure (MAP) curve at baseline and with continuous AngII infusion (1,000 ng/kg/min) for 15 days. Day 5 MAP values are also presented in Figure 2A. (B) Renal AngII levels from Control and PT ACE2–KO mice. (C) Urinary ACE2 activity. (D) Immunoblots of angiotensinogen (n = 5), ACE1 (n = 6), and ACE2 (n = 6) protein abundance at baseline and with 5 days of AngII infusion. All lanes of the angiotensinogen immunoblot were run on the same gel but were noncontiguous. (E–G) Quantification of renal angiotensinogen, ACE1, and ACE2 abundance. (H and I) Immunoblots depicting urinary abundance of full-length ACE2 (FL-ACE2) and soluble ACE2 (sACE2) at day 6 and 14 days of AngII treatment. Coomassie brilliant blue stain was used to demonstrate similar loading for urine blots (56, 62). Data expressed as mean ± SEM. MAP (n = 16) was analyzed by mixed-effects analysis with Fisher’s LSD pairwise comparison post hoc analysis. Renal AngII (n = 3–10), urinary ACE2 activity (n = 6), and renal protein abundance were analyzed using a 2-way ANOVA with Tukey’s post hoc multiple comparison. Urinary ACE2 levels were analyzed by an unpaired 2-tailed t test with Welch’s correction (H and I). *P < 0.05, **P < 0.01, ***P < 0.001, ****P < 0.0001.
PT ACE2 stabilizes response to AngII by mitigating increases in intrarenal RAS activity. PT ACE2–KO mice developed higher elevation of MAPs during the initial days of AngII treatment compared with Control mice, with statistically significant differences between groups at days 3, 4, 5, and 6 (Figure 2A and Figure 3A). Increased renal AngII levels were seen in PT ACE2–KO mice throughout this period with the biggest difference on day 4, corresponding to the timing of exaggerated BP response to AngII (day 4 AngII: 896.7 ± 330.4 fmol/g in PT ACE2–KO versus 536.5 ± 325.2 fmol/g in Control, P = 0.04; Figure 3B). In PT ACE2–KO kidneys, renal cortical abundance of angiotensinogen tended to be higher during AngII infusion compared with baseline by approximately 30% (1.3 ± 0.22; Figure 3, D and E), but this did not reach statistical significance. No differences in ACE1 abundance were detected in either Control or PT ACE2–KO mice (Figure 3, D and F). Control mice increased renal ACE2 protein levels by nearly 60% from baseline (1.59 ± 0.04-fold, P < 0.05; Figure 3, D and G), whereas ACE2 levels remained unchanged in PT ACE2–KO mice, as expected.
To investigate the effect of PT ACE2 deletion on systemic RAS tone, we assessed plasma ACE2 enzymatic activity, kidney renin expression, urinary aldosterone excretion, and circulating RAS metabolites in PT ACE2–KO versus Control mice after 5 days of AngII infusion (Supplemental Figure 1, A–C, and Supplemental Table 2; supplemental material available online with this article; https://doi.org/10.1172/jci.insight.179960DS1), as previously described (38). Global Ace2 deletion has previously been shown to alter circulating AngII (Ang[1-8]) levels (39). However, in PT ACE2–KO and Control mice we observed no significant differences in plasma ACE2 activity, kidney Ren1 expression, aldosterone excretion, or in circulating RAS metabolites. Although Ang(1–7) levels were not altered, the formation of Ang(1–9) from Ang(1–10) appears lower in the PT ACE2–KO mice, trending toward significance (Supplemental Table 2). The ratio of Ang(1–9)/Ang(1–10) — product over reactant catalyzed by ACE2 — was 6-fold higher in the Control as compared with PT ACE2 KO (P = 0.08). While these findings do not conclusively demonstrate alterations in the systemic RAS, the observed trends across multiple RAS components support an overall reduction of systemic RAS activity. These findings suggest that PT ACE2 deletion predominantly affects the intrarenal RAS, and that this is sufficient to influence HTN in PT ACE2–KO mice (Figure 2A and Figure 3A) (5, 40). To determine whether fluctuations in urinary ACE2 abundance underlie the temporal pattern of BP differences, we assessed urinary ACE2 activity (Figure 3C) and protein levels (Figure 3, H and I) in PT ACE2–KO and Control mice after 6 days or 14 days of AngII infusion. As shown in Figure 3C, urinary ACE2 activity increased significantly by approximately 52% in Control mice during the initial 3 days of AngII infusion (day 2 versus day 0, P < 0.05), suggesting an acute compensatory response to AngII infusion. By contrast, urinary ACE2 activity did not increase during the first week of AngII infusion in PT ACE2 KOs even during this period of transiently higher MAPs and AngII peptide levels. After day 2 of AngII infusion, urinary ACE2 activity fell progressively in Control mice such that, by day 7, it resembled the consistent, low levels seen in PT ACE2 KOs, demonstrating that AngII infusion induces an acute upregulation of ACE2 in Control mice, potentially as a mechanism to protect against BP elevation.
Previous studies have shown that both 98 kDa (“full-length”) and 75 kDa (“soluble”) ACE2 fragments can be detected in urine, and sACE2 can be filtered by the glomerulus to reach the lumen of the nephron (27), where it influences the activity of the intrarenal RAS. Thus, urinary ACE2 protein and activity levels may reflect the combined activities of full-length and sACE2. To delineate the relative contributions of PT-derived and systemic-derived sACE2 to urinary ACE2 protein, we probed for ACE2 in urine by immunoblotting with an antibody targeted to the N-terminus, which could distinguish the 2 isoforms by size. After 6 days of AngII treatment, both the 98 kDa full-length and 75 kDa sACE2 fragments were observed in urine of Control animals (Figure 3H). By contrast, only modest amounts of sACE2 and low levels of full-length ACE2 were observed in urine from PT ACE2–KO mice. Later, after 14 days of AngII infusion, levels of both full-length ACE2 and sACE2 were low in Control urine, consistent with the observed reduction in urinary ACE2 activity over time (Figure 3I). By 14 days, sACE2 was minimally detected in the urine of PT ACE2–KO mice. Taken together, these findings identify the PT as the major source of both full-length and sACE2 in urine, and we suggest that these moieties contribute to the antihypertensive actions of ACE2 in the early phase of AngII hypertension. Altogether, the increases in renal and urinary ACE2 in Control mice during the first week of AngII infusion appear to mitigate intrarenal RAS activity, corresponding with lower BP.
Electrolyte homeostasis in PT ACE2–KO mice. As our studies target the renal PT, the major site of sodium reabsorption by the nephron, we performed a balance study to determine whether the early hypertensive response seen in PT ACE2–KO mice was associated with altered sodium handling. No difference in urinary sodium excretion (UNaV) or sodium balance was observed between PT ACE2–KO and Control mice during the first 5 days of AngII treatment (Supplemental Figure 2, A and D) or in response to an acute saline challenge (Supplemental Table 3). Potassium balance was also similar in the 2 groups (Supplemental Figure 2, B and E). While we did not detect differences in creatinine clearance (CCr), a marker for GFR, or blood urea nitrogen during AngII treatment in either PT ACE2 KO or Control mice (Supplemental Figure 2, F and G), there was a modest trend toward increased CCr in PT ACE2–KO mice under baseline conditions, suggesting a role for PT-derived ACE2 in modulating renal function. There was an increase in albuminuria in PT ACE2–KO mice at this time point (Supplemental Figure 2H), consistent with their elevated BP and LV hypertrophy. As outlined below, the similarities in sodium and potassium balance may be explained by our sodium transporter studies, which reveal independent molecular changes aimed at maintaining sodium homeostasis.
Alterations in sodium transporters along the nephron. Intrarenal RAS activity drives increases in sodium reabsorption when effective circulating volume is low and can drive hypertension if RAS activity is too high. In AngII-mediated hypertension, antinatriuretic effects are associated with increased sodium transporter abundance along the cortical thick ascending limb (TAL) to the cortical collecting duct (CCD) (5, 7, 41), which are often balanced by pressure-natriuretic effects in order to decrease sodium transporter abundance in the proximal nephron (41, 42). To determine whether changes in sodium handling support the amplified response to AngII infusion in PT ACE2–KO mice associated with transient increases in kidney AngII levels, we examined abundance of sodium transporters along the renal tubule in Control and PT ACE2 KO at baseline and with 5 days of AngII infusion (Figure 4, A–J, Figure 5, A–J, and Figure 6, A–F). Of the key transporters we profiled at baseline within the PT and medullary TAL, sodium-glucose cotransporter (SGLT2) abundance was higher while the cleaved, activated form of the epithelial sodium channel γ-subunit (ENaCγ) was lower in abundance in PT ACE2–KO mice (Figure 4, A and C, and Figure 6, A and F). More changes in transporter abundance were observed during AngII hypertension. In both Control and PT ACE2–KO mice, AngII infusion decreases the abundance of distal nephron transporters: Na+/K+/Cl– cotransporter (NKCC2, both total and phosphorylated forms; Figure 5, A–C) and claudin 8 (which prevents sodium back-leak along CCD; Figure 5, A and H). In PT ACE2–KO mice treated with AngII, SGLT2 abundance decreased (Figure 4, A and C), along with a reduction in the phosphorylated form of the aquaporin 2 water channel (AQP2p; Figure 5, A and J) to the same level as Controls. AngII-induced reductions in SGLT2 and AQP2p reflect efforts to maintain homeostasis by enhancing natriuresis and diuresis in PT ACE2–KO mice.
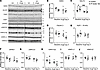 Figure 4
Alterations in sodium transporters along the proximal tubule and medullary thick ascending limb. (A) Immunoblots depicting key sodium transporter abundance at baseline and with 5 days of AngII. (B) Sodium hydrogen exchanger 3 (NHE3). (C) Sodium-glucose cotransporter 2 (SGLT2). (D) Claudin 2. (E) Aquaporin 1 major channel (AQP1-35 kDa). (F) Medullary NHE3. (G) Medullary sodium-potassium-chloride cotransporter (mNKCC2). (H) Phosphorylated mNKCC2. (I) Na+/K+ ATPase (NKA), α 1 subunit. (J) NKA β 1 subunit. All lanes of the immunoblots for mNHE3, mNKCC2, mNKCC2p, mNKA α1, and mNKA β1 were run on the same gel but were noncontiguous (n = 5–6 mice per group). Transporter abundance was analyzed as a 2-way ANOVA with Tukey’s multiple-comparison post hoc analysis. *P < 0.05, ***P < 0.001.
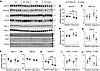 Figure 5
Alterations in sodium transporters along the more distal segments of the nephron. (A) Immunoblots depicting key sodium transporter abundance at baseline and with 5 days of AngII. (B) Sodium-potassium-chloride cotransporter (NKCC2). (C) Phosphorylated NKCC2. (D) Sodium-chloride cotransporter (NCC). (E) Phosphorylated NCC. (F) Na+/K+ ATPase (NKA), α1 subunit. (G) NKA β1 subunit. (H) Claudin 8 (Cldn 8). (I) Aquaporin 2 (AQP2), major band (37 kDa). (J) Phosphorylated AQP2 major band. Transporter abundance was analyzed as a 2-way ANOVA with Tukey’s multiple-comparison post hoc analysis (n = 5–6 mice per group). **P < 0.01, ***P < 0.001, ****P < 0.0001.
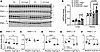 Figure 6
Inappropriate regulation of ENaCγ and Na,K-ATPase activity impairs pressure natriuresis in PT ACE2–KO mice. (A) Immunoblots depicting epithelial sodium channel (ENaC) abundance at baseline and with 5 days of AngII. (B) Full-length ENaCα (ENaCα - FL) (C) Cleaved ENaCα (ENaCα – cl). (D) ENaCβ (ENaC β). (E) Full-length ENaCγ (ENaCγ-FL). (F) Cleaved ENaCγ (ENaCγ-cl). (G) K+-Dependent p-nitrophenyl phosphatase (pNPPase), a surrogate for Na,K-ATPase activity. Data expressed as mean ± SEM; transporter abundance was analyzed as a 2-way ANOVA with Tukey’s multiple-comparison post hoc analysis. pNPPase activity was analyzed by mixed-effects analysis with Fisher’s LSD pairwise comparison post hoc analysis (n = 5–6 mice per group). *P < 0.05, **P < 0.01, ***P < 0.001, ****P < 0.0001.
Inappropriate regulation of ENaC and Na,K-ATPase activity impairs pressure natriuresis in PT ACE2–KO mice. Notably, we observe a difference between Control and PT ACE2–KO mice with respect to regulation of the ENaC in response to AngII that could contribute to the higher BP after 5 days of AngII infusion (Figure 6, A–F). In Control mice, a 20% reduction in full-length ENaCα (P < 0.05) and a 30% reduction in the cleaved, activated form of ENaCγ indicate increased pressure natriuresis (P = 0.0001; Figure 6, A, B, and F). Importantly, ENaCα and cleaved ENaCγ were not reduced in response to AngII infusion in PT ACE2–KO mice, suggesting an insufficient natriuretic response to AngII. The inability of PT ACE2–KO mice to regulate ENaC activity in response to AngII may explain the exaggerated BP response observed in PT ACE2–KO mice.
Additionally, we examined Na,K-ATPase activity, a key molecular pump that fuels sodium reabsorption all along the nephron and is the main driver of kidney oxygen consumption. Na,K-ATPase activity was higher in the homogenates from cortex than medulla, as expected (Figure 6G). Na,K-ATPase activity was unchanged by loss of ACE2 from the PT at baseline; however, AngII increased Na,K-ATPase activity in medulla of PT ACE2–KO mice (P = 0.0001), with a marginal but nonsignificant increase in cortical activity. In contrast, no increase in Na,K-ATPase was observed in Control animals. Along with differential regulation of ENaC, this finding suggests that the higher local AngII in PT ACE2–KO mice promotes AngII-dependent increases in sodium pump activity, together reflecting a blunted pressure natriuretic response to AngII (Figure 6, A, B, and D).
Transcriptional changes in the kidney in response to treatment with AngII for 5 days. To quantify how loss of PT-derived ACE2 affects gene expression in the kidney during periods of hypertension and dysregulated intrarenal RAS, we performed snRNA-seq on cryopreserved kidneys from Control and PT ACE2–KO mice treated with either saline or AngII for 5 days. After quality control filtering, we obtained 80,013 nuclei from 8 mice consisting of 2 replicates for each experimental group (Table 2). We captured all major cell types of the kidney based on canonical kidney cell markers (Figure 7, A and B, and Supplemental Figures 3 and 4) (43). We did not detect any bias in the distribution of cell types based on experimental group (Supplemental Figure 5, A and B).
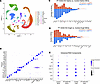 Figure 7
Transcriptional changes in the kidney in response to treatment with AngII for 5 days. (A) UMAP plots of all mouse kidney datasets integrated with FindIntegrationAnchors. PTS1; S1 segment of proximal tubule; PTS2, S2 segment of proximal tubule; PTS3, S3 segment of proximal tubule; dTL, descending limb of Loop of Henle; TAL, thick ascending limb of Loop of Henle; MD, macula densa; DCT1, early segment of distal convoluted tubule; DCT2, late segment of distal convoluted tubule; CNT, connecting tubule; PC, principal cells; ICA, type A intercalated cells; ICB, type B intercalated cells; Podo, podocytes; PEC, parietal epithelial cells; EC, endothelial cells; Fib, fibroblasts; Mes, mesangial cells; Macro, macrophages; B & T, B and T lymphocytes; Uro, uroepithelial cells. (B) Dot plot displaying gene expression patterns of cluster-enriched markers. (C and D) Number of differentially expressed genes per cluster in saline- and AngII-treated groups. (E) Intrarenal RAS gene expression in proximal tubule segments 1–3, contractile cells, mesangial cells, and macrophages.
Next, we quantified the differentially expressed genes (DEGs) for all cell clusters in each group. Comparison of PT ACE2–KO versus Control kidneys with saline or AngII revealed that all 3 segments of the PT were among the clusters with the highest number of DEGs (Figure 7, C and D), demonstrating that loss of ACE2 significantly affects gene expression locally, predominantly within the PT.
Additionally, we took a targeted look at the transcriptomic data by assessing the profile of intrarenal RAS components in multiple cell types in the kidney (clusters: PT segments 1–3, contractile cells, mesangial cells, and macrophages; Figure 7E), which supports an increase in Ace2 and Agt expression in AngII-treated Control kidneys. Increased Adam17 expression in AngII-treated Control kidneys is consistent with the increased ACE2 cleavage we observed in our urine studies (Figure 7E and Figure 3, C, H, and I). In Control mice, AngII treatment also induced an increase in Cltrn (collectrin), a homologue of the ACE2 membrane-anchoring domain, an effect that was not seen in PT ACE2–KO mice. In PT ACE2 KO kidneys, Ace, Agt, and Adam17 expression increased with AngII treatment, consistent with activation of the intrarenal RAS.
Differential pathway enrichment in PT ACE2–KO and Control mice. To further explore changes in gene expression in the PT, we employed gene set enrichment analysis (GSEA) using an a priori defined set of genes associated with known biological functions, and we compared pathways unique to either saline- or AngII-treated PT ACE2–KO kidneys relative to their Control counterparts. In saline-treated PT ACE2–KO mice, pathway analysis demonstrated more positive enrichment of well-known PT-related functions, including upregulation of transporter complex (q = 0.032), proton transmembrane transport (q = 8.18 × 10⁻⁵), proton transmembrane transporter activity (q = 2.20 × 10⁻⁶), and glomerular basement membrane development (q = 0.035) compared with saline-treated Control kidneys (Figure 8A and Supplemental Table 4). Concomitant downregulation of transcripts related to regulation of transforming growth factor β receptor (TGFβR) signaling (q = 0.026), cellular response to metal ion (q = 0.012), and negative regulation of transmembrane transport (q = 0.029) were also seen in saline-treated PT ACE2–KO mice, along with downregulation of response to sodium phosphate and proline transport. Interestingly, genotype-dependent transcriptional differences observed under baseline conditions were preserved following AngII treatment, underscoring the strong regulatory influence of ACE2 on PT function.
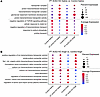 Figure 8
Differential pathway enrichment in PT ACE2–KO and Control mice. (A) Enrichment of pathways found significant in PT ACE2 KO Saline versus Control Saline. (B) Enrichment of pathways found significant in PT ACE2 KO AngII versus Control AngII.
However, AngII treatment induced transcriptional differences between Control and PT ACE2–KO mice that were absent under baseline conditions (Figure 8B and Supplemental Table 4). Specifically, in Control mice, AngII treatment was associated with negative enrichment of ion and solute transport–associated genes, including solute:sodium symporter activity (q = 2.16 × 10⁻⁵), sodium-independent organic anion transmembrane transporter activity (q = 0.002), and positive regulation of ion transmembrane transporter activity (q = 0.039), while in PT ACE2 KO kidneys, these pathways were enriched similar to saline-treated Control and PT ACE2–KO groups. Assessment of pathways associated with core PT reabsorption processes reveal the opposite pattern: AngII-treated PT ACE2–KO kidneys demonstrate lower expression of renal absorption (q = 0.003), sodium ion transmembrane transport (q = 0.003), and regulation of amino acid import across the plasma membrane (q = 0.026), while in the Control AngII group, enrichment of these pathways is maintained at levels similar to the saline-treated Control and PT ACE2–KO groups. Together, these findings demonstrate that loss of ACE2 in the PT fundamentally reshapes the transcriptional response to AngII, particularly across key transport pathways.
Loss of ACE2 from the PT led to significant transcriptional changes of apical membrane-related genes (Supplemental Figure 6A and Supplemental Table 5). Compared with the saline-treated Control group, saline-treated PT ACE2–KO mice displayed significant negative enrichment of pathways involved in regulation of actin filament organization (q = 0.0088), regulation of actin cytoskeleton organization (q = 0.02), cluster of actin-based cell projections (q = 0.0004), cell projection membrane (q = 0.033), apical plasma membrane (q = 8.32 × 10⁻⁶), and brush border (q = 0.010). Treatment with AngII led to greater dissonance between PT ACE2–KO and Control gene expression; genes associated with these pathways were further downregulated in PT ACE2 KO AngII kidneys and upregulated in Control AngII samples — e.g., brush border (q = 3.82 × 10⁻¹⁶), cell projection membrane (q = 1.54 × 10⁻¹⁴) and cluster of actin-based projections (q = 1.23 × 10⁻¹³). These changes reveal categorical differences of PT response to AngII in the absence of PT ACE2.
To complement our analysis of transporter protein abundance (Figure 4, Figure 5, and Figure 6), we also examined transporter gene expression along the nephron (Supplemental Figure 7). Assessment of transporters along the more proximal nephron (clusters: PT segments 1-3 and the TAL revealed that AngII led to contrasting expression of Cldn10, Aqp1, and Cldn2 between PT ACE2–KO and Control groups (Supplemental Figure 7A). Even greater discordance in transporter gene expression between AngII-treated PT ACE2–KO and Control groups was seen along the distal nephron segments (TAL, macula densa, distal convoluted tubule 1 and 2, connecting tubule, A and B type intercalated cells, and urothelium clusters; Supplemental Figure 7B), including upregulation of Scnn1g, Scnn1a, Slc12a3, and Aqp2. Importantly, differential transcriptional regulation of ENaC subunits and RAS components mirror the changes in transporter abundance and levels of RAS components measured by immunoblotting and enzymatic assay, and they suggest exaggerated AngII effects in PT ACE2–KO mice.


