
Clinical Research and Public HealthCardiologyEndocrinology
Open Access |  10.1172/jci.insight.204463
A validated, modifiable proteomic score from the EXSCEL trial predicts cardiovascular events in diabetes
Kristin M. Corey,1 Maggie Nguyen,1 Michael Y. Mi,2 Megan E. Ramaker,1 Ilya Zhbannikov,1 Harald Sourij,3 G. Michael Felker,4 Naveed Sattar,5 Jennifer B. Green,4 Pamela S. Douglas,4,6 Robert E. Gerszten,2 Robert J. Mentz,4,6 Adrian F. Hernandez,4,6 Rury R. Holman,7 Bruce M. Psaty,8,9 James S. Floyd,8 and Svati H. Shah1,4,6
1Duke Molecular Physiology Institute, Duke University School of Medicine, Durham, North Carolina, USA.
2Cardiovascular Medicine, Beth Israel Deaconess Medical Center, Boston Massachusetts, USA.
3Cardiometabolic Trials Unit, Division of Endocrinology and Diabetology, Medical University of Graz, Graz, Austria.
4Duke Clinical Research Institute, Durham, North Carolina, USA.
5Institute of Cardiovascular & Medical Sciences, University of Glasgow, Glasgow, United Kingdom.
6Division of Cardiology, Department of Medicine, Duke University School of Medicine, Durham, North Carolina, USA.
7Diabetes Trials Unit, Radcliffe Department of Medicine, University of Oxford, Oxford, United Kingdom.
8Cardiovascular Health Research Unit, Department of Medicine, and
9Departments of Epidemiology and Health Systems and Population Health, University of Washington, Seattle, Washington, USA.
Address correspondence to: Svati H. Shah, 300 N Duke Street, DUMC Box 104775, Durham, North Carolina 27701, USA. Email: svati.shah@duke.edu.
Find articles by Corey, K. in: PubMed | Google Scholar
1Duke Molecular Physiology Institute, Duke University School of Medicine, Durham, North Carolina, USA.
2Cardiovascular Medicine, Beth Israel Deaconess Medical Center, Boston Massachusetts, USA.
3Cardiometabolic Trials Unit, Division of Endocrinology and Diabetology, Medical University of Graz, Graz, Austria.
4Duke Clinical Research Institute, Durham, North Carolina, USA.
5Institute of Cardiovascular & Medical Sciences, University of Glasgow, Glasgow, United Kingdom.
6Division of Cardiology, Department of Medicine, Duke University School of Medicine, Durham, North Carolina, USA.
7Diabetes Trials Unit, Radcliffe Department of Medicine, University of Oxford, Oxford, United Kingdom.
8Cardiovascular Health Research Unit, Department of Medicine, and
9Departments of Epidemiology and Health Systems and Population Health, University of Washington, Seattle, Washington, USA.
Address correspondence to: Svati H. Shah, 300 N Duke Street, DUMC Box 104775, Durham, North Carolina 27701, USA. Email: svati.shah@duke.edu.
Find articles by Nguyen, M. in: PubMed | Google Scholar
1Duke Molecular Physiology Institute, Duke University School of Medicine, Durham, North Carolina, USA.
2Cardiovascular Medicine, Beth Israel Deaconess Medical Center, Boston Massachusetts, USA.
3Cardiometabolic Trials Unit, Division of Endocrinology and Diabetology, Medical University of Graz, Graz, Austria.
4Duke Clinical Research Institute, Durham, North Carolina, USA.
5Institute of Cardiovascular & Medical Sciences, University of Glasgow, Glasgow, United Kingdom.
6Division of Cardiology, Department of Medicine, Duke University School of Medicine, Durham, North Carolina, USA.
7Diabetes Trials Unit, Radcliffe Department of Medicine, University of Oxford, Oxford, United Kingdom.
8Cardiovascular Health Research Unit, Department of Medicine, and
9Departments of Epidemiology and Health Systems and Population Health, University of Washington, Seattle, Washington, USA.
Address correspondence to: Svati H. Shah, 300 N Duke Street, DUMC Box 104775, Durham, North Carolina 27701, USA. Email: svati.shah@duke.edu.
Find articles by Mi, M. in: PubMed | Google Scholar
1Duke Molecular Physiology Institute, Duke University School of Medicine, Durham, North Carolina, USA.
2Cardiovascular Medicine, Beth Israel Deaconess Medical Center, Boston Massachusetts, USA.
3Cardiometabolic Trials Unit, Division of Endocrinology and Diabetology, Medical University of Graz, Graz, Austria.
4Duke Clinical Research Institute, Durham, North Carolina, USA.
5Institute of Cardiovascular & Medical Sciences, University of Glasgow, Glasgow, United Kingdom.
6Division of Cardiology, Department of Medicine, Duke University School of Medicine, Durham, North Carolina, USA.
7Diabetes Trials Unit, Radcliffe Department of Medicine, University of Oxford, Oxford, United Kingdom.
8Cardiovascular Health Research Unit, Department of Medicine, and
9Departments of Epidemiology and Health Systems and Population Health, University of Washington, Seattle, Washington, USA.
Address correspondence to: Svati H. Shah, 300 N Duke Street, DUMC Box 104775, Durham, North Carolina 27701, USA. Email: svati.shah@duke.edu.
Find articles by Ramaker, M. in: PubMed | Google Scholar
1Duke Molecular Physiology Institute, Duke University School of Medicine, Durham, North Carolina, USA.
2Cardiovascular Medicine, Beth Israel Deaconess Medical Center, Boston Massachusetts, USA.
3Cardiometabolic Trials Unit, Division of Endocrinology and Diabetology, Medical University of Graz, Graz, Austria.
4Duke Clinical Research Institute, Durham, North Carolina, USA.
5Institute of Cardiovascular & Medical Sciences, University of Glasgow, Glasgow, United Kingdom.
6Division of Cardiology, Department of Medicine, Duke University School of Medicine, Durham, North Carolina, USA.
7Diabetes Trials Unit, Radcliffe Department of Medicine, University of Oxford, Oxford, United Kingdom.
8Cardiovascular Health Research Unit, Department of Medicine, and
9Departments of Epidemiology and Health Systems and Population Health, University of Washington, Seattle, Washington, USA.
Address correspondence to: Svati H. Shah, 300 N Duke Street, DUMC Box 104775, Durham, North Carolina 27701, USA. Email: svati.shah@duke.edu.
Find articles by Zhbannikov, I. in: PubMed | Google Scholar
1Duke Molecular Physiology Institute, Duke University School of Medicine, Durham, North Carolina, USA.
2Cardiovascular Medicine, Beth Israel Deaconess Medical Center, Boston Massachusetts, USA.
3Cardiometabolic Trials Unit, Division of Endocrinology and Diabetology, Medical University of Graz, Graz, Austria.
4Duke Clinical Research Institute, Durham, North Carolina, USA.
5Institute of Cardiovascular & Medical Sciences, University of Glasgow, Glasgow, United Kingdom.
6Division of Cardiology, Department of Medicine, Duke University School of Medicine, Durham, North Carolina, USA.
7Diabetes Trials Unit, Radcliffe Department of Medicine, University of Oxford, Oxford, United Kingdom.
8Cardiovascular Health Research Unit, Department of Medicine, and
9Departments of Epidemiology and Health Systems and Population Health, University of Washington, Seattle, Washington, USA.
Address correspondence to: Svati H. Shah, 300 N Duke Street, DUMC Box 104775, Durham, North Carolina 27701, USA. Email: svati.shah@duke.edu.
Find articles by Sourij, H. in: PubMed | Google Scholar
1Duke Molecular Physiology Institute, Duke University School of Medicine, Durham, North Carolina, USA.
2Cardiovascular Medicine, Beth Israel Deaconess Medical Center, Boston Massachusetts, USA.
3Cardiometabolic Trials Unit, Division of Endocrinology and Diabetology, Medical University of Graz, Graz, Austria.
4Duke Clinical Research Institute, Durham, North Carolina, USA.
5Institute of Cardiovascular & Medical Sciences, University of Glasgow, Glasgow, United Kingdom.
6Division of Cardiology, Department of Medicine, Duke University School of Medicine, Durham, North Carolina, USA.
7Diabetes Trials Unit, Radcliffe Department of Medicine, University of Oxford, Oxford, United Kingdom.
8Cardiovascular Health Research Unit, Department of Medicine, and
9Departments of Epidemiology and Health Systems and Population Health, University of Washington, Seattle, Washington, USA.
Address correspondence to: Svati H. Shah, 300 N Duke Street, DUMC Box 104775, Durham, North Carolina 27701, USA. Email: svati.shah@duke.edu.
Find articles by Felker, G. in: PubMed | Google Scholar
1Duke Molecular Physiology Institute, Duke University School of Medicine, Durham, North Carolina, USA.
2Cardiovascular Medicine, Beth Israel Deaconess Medical Center, Boston Massachusetts, USA.
3Cardiometabolic Trials Unit, Division of Endocrinology and Diabetology, Medical University of Graz, Graz, Austria.
4Duke Clinical Research Institute, Durham, North Carolina, USA.
5Institute of Cardiovascular & Medical Sciences, University of Glasgow, Glasgow, United Kingdom.
6Division of Cardiology, Department of Medicine, Duke University School of Medicine, Durham, North Carolina, USA.
7Diabetes Trials Unit, Radcliffe Department of Medicine, University of Oxford, Oxford, United Kingdom.
8Cardiovascular Health Research Unit, Department of Medicine, and
9Departments of Epidemiology and Health Systems and Population Health, University of Washington, Seattle, Washington, USA.
Address correspondence to: Svati H. Shah, 300 N Duke Street, DUMC Box 104775, Durham, North Carolina 27701, USA. Email: svati.shah@duke.edu.
Find articles by Sattar, N. in: PubMed | Google Scholar
1Duke Molecular Physiology Institute, Duke University School of Medicine, Durham, North Carolina, USA.
2Cardiovascular Medicine, Beth Israel Deaconess Medical Center, Boston Massachusetts, USA.
3Cardiometabolic Trials Unit, Division of Endocrinology and Diabetology, Medical University of Graz, Graz, Austria.
4Duke Clinical Research Institute, Durham, North Carolina, USA.
5Institute of Cardiovascular & Medical Sciences, University of Glasgow, Glasgow, United Kingdom.
6Division of Cardiology, Department of Medicine, Duke University School of Medicine, Durham, North Carolina, USA.
7Diabetes Trials Unit, Radcliffe Department of Medicine, University of Oxford, Oxford, United Kingdom.
8Cardiovascular Health Research Unit, Department of Medicine, and
9Departments of Epidemiology and Health Systems and Population Health, University of Washington, Seattle, Washington, USA.
Address correspondence to: Svati H. Shah, 300 N Duke Street, DUMC Box 104775, Durham, North Carolina 27701, USA. Email: svati.shah@duke.edu.
Find articles by Green, J. in: PubMed | Google Scholar
1Duke Molecular Physiology Institute, Duke University School of Medicine, Durham, North Carolina, USA.
2Cardiovascular Medicine, Beth Israel Deaconess Medical Center, Boston Massachusetts, USA.
3Cardiometabolic Trials Unit, Division of Endocrinology and Diabetology, Medical University of Graz, Graz, Austria.
4Duke Clinical Research Institute, Durham, North Carolina, USA.
5Institute of Cardiovascular & Medical Sciences, University of Glasgow, Glasgow, United Kingdom.
6Division of Cardiology, Department of Medicine, Duke University School of Medicine, Durham, North Carolina, USA.
7Diabetes Trials Unit, Radcliffe Department of Medicine, University of Oxford, Oxford, United Kingdom.
8Cardiovascular Health Research Unit, Department of Medicine, and
9Departments of Epidemiology and Health Systems and Population Health, University of Washington, Seattle, Washington, USA.
Address correspondence to: Svati H. Shah, 300 N Duke Street, DUMC Box 104775, Durham, North Carolina 27701, USA. Email: svati.shah@duke.edu.
Find articles by
Douglas, P.
in:
PubMed
|
Google Scholar
|

1Duke Molecular Physiology Institute, Duke University School of Medicine, Durham, North Carolina, USA.
2Cardiovascular Medicine, Beth Israel Deaconess Medical Center, Boston Massachusetts, USA.
3Cardiometabolic Trials Unit, Division of Endocrinology and Diabetology, Medical University of Graz, Graz, Austria.
4Duke Clinical Research Institute, Durham, North Carolina, USA.
5Institute of Cardiovascular & Medical Sciences, University of Glasgow, Glasgow, United Kingdom.
6Division of Cardiology, Department of Medicine, Duke University School of Medicine, Durham, North Carolina, USA.
7Diabetes Trials Unit, Radcliffe Department of Medicine, University of Oxford, Oxford, United Kingdom.
8Cardiovascular Health Research Unit, Department of Medicine, and
9Departments of Epidemiology and Health Systems and Population Health, University of Washington, Seattle, Washington, USA.
Address correspondence to: Svati H. Shah, 300 N Duke Street, DUMC Box 104775, Durham, North Carolina 27701, USA. Email: svati.shah@duke.edu.
Find articles by
Gerszten, R.
in:
PubMed
|
Google Scholar
|
1Duke Molecular Physiology Institute, Duke University School of Medicine, Durham, North Carolina, USA.
2Cardiovascular Medicine, Beth Israel Deaconess Medical Center, Boston Massachusetts, USA.
3Cardiometabolic Trials Unit, Division of Endocrinology and Diabetology, Medical University of Graz, Graz, Austria.
4Duke Clinical Research Institute, Durham, North Carolina, USA.
5Institute of Cardiovascular & Medical Sciences, University of Glasgow, Glasgow, United Kingdom.
6Division of Cardiology, Department of Medicine, Duke University School of Medicine, Durham, North Carolina, USA.
7Diabetes Trials Unit, Radcliffe Department of Medicine, University of Oxford, Oxford, United Kingdom.
8Cardiovascular Health Research Unit, Department of Medicine, and
9Departments of Epidemiology and Health Systems and Population Health, University of Washington, Seattle, Washington, USA.
Address correspondence to: Svati H. Shah, 300 N Duke Street, DUMC Box 104775, Durham, North Carolina 27701, USA. Email: svati.shah@duke.edu.
Find articles by Mentz, R. in: PubMed | Google Scholar
1Duke Molecular Physiology Institute, Duke University School of Medicine, Durham, North Carolina, USA.
2Cardiovascular Medicine, Beth Israel Deaconess Medical Center, Boston Massachusetts, USA.
3Cardiometabolic Trials Unit, Division of Endocrinology and Diabetology, Medical University of Graz, Graz, Austria.
4Duke Clinical Research Institute, Durham, North Carolina, USA.
5Institute of Cardiovascular & Medical Sciences, University of Glasgow, Glasgow, United Kingdom.
6Division of Cardiology, Department of Medicine, Duke University School of Medicine, Durham, North Carolina, USA.
7Diabetes Trials Unit, Radcliffe Department of Medicine, University of Oxford, Oxford, United Kingdom.
8Cardiovascular Health Research Unit, Department of Medicine, and
9Departments of Epidemiology and Health Systems and Population Health, University of Washington, Seattle, Washington, USA.
Address correspondence to: Svati H. Shah, 300 N Duke Street, DUMC Box 104775, Durham, North Carolina 27701, USA. Email: svati.shah@duke.edu.
Find articles by
Hernandez, A.
in:
PubMed
|
Google Scholar
|
1Duke Molecular Physiology Institute, Duke University School of Medicine, Durham, North Carolina, USA.
2Cardiovascular Medicine, Beth Israel Deaconess Medical Center, Boston Massachusetts, USA.
3Cardiometabolic Trials Unit, Division of Endocrinology and Diabetology, Medical University of Graz, Graz, Austria.
4Duke Clinical Research Institute, Durham, North Carolina, USA.
5Institute of Cardiovascular & Medical Sciences, University of Glasgow, Glasgow, United Kingdom.
6Division of Cardiology, Department of Medicine, Duke University School of Medicine, Durham, North Carolina, USA.
7Diabetes Trials Unit, Radcliffe Department of Medicine, University of Oxford, Oxford, United Kingdom.
8Cardiovascular Health Research Unit, Department of Medicine, and
9Departments of Epidemiology and Health Systems and Population Health, University of Washington, Seattle, Washington, USA.
Address correspondence to: Svati H. Shah, 300 N Duke Street, DUMC Box 104775, Durham, North Carolina 27701, USA. Email: svati.shah@duke.edu.
Find articles by
Holman, R.
in:
PubMed
|
Google Scholar
|
1Duke Molecular Physiology Institute, Duke University School of Medicine, Durham, North Carolina, USA.
2Cardiovascular Medicine, Beth Israel Deaconess Medical Center, Boston Massachusetts, USA.
3Cardiometabolic Trials Unit, Division of Endocrinology and Diabetology, Medical University of Graz, Graz, Austria.
4Duke Clinical Research Institute, Durham, North Carolina, USA.
5Institute of Cardiovascular & Medical Sciences, University of Glasgow, Glasgow, United Kingdom.
6Division of Cardiology, Department of Medicine, Duke University School of Medicine, Durham, North Carolina, USA.
7Diabetes Trials Unit, Radcliffe Department of Medicine, University of Oxford, Oxford, United Kingdom.
8Cardiovascular Health Research Unit, Department of Medicine, and
9Departments of Epidemiology and Health Systems and Population Health, University of Washington, Seattle, Washington, USA.
Address correspondence to: Svati H. Shah, 300 N Duke Street, DUMC Box 104775, Durham, North Carolina 27701, USA. Email: svati.shah@duke.edu.
Find articles by Psaty, B. in: PubMed | Google Scholar
1Duke Molecular Physiology Institute, Duke University School of Medicine, Durham, North Carolina, USA.
2Cardiovascular Medicine, Beth Israel Deaconess Medical Center, Boston Massachusetts, USA.
3Cardiometabolic Trials Unit, Division of Endocrinology and Diabetology, Medical University of Graz, Graz, Austria.
4Duke Clinical Research Institute, Durham, North Carolina, USA.
5Institute of Cardiovascular & Medical Sciences, University of Glasgow, Glasgow, United Kingdom.
6Division of Cardiology, Department of Medicine, Duke University School of Medicine, Durham, North Carolina, USA.
7Diabetes Trials Unit, Radcliffe Department of Medicine, University of Oxford, Oxford, United Kingdom.
8Cardiovascular Health Research Unit, Department of Medicine, and
9Departments of Epidemiology and Health Systems and Population Health, University of Washington, Seattle, Washington, USA.
Address correspondence to: Svati H. Shah, 300 N Duke Street, DUMC Box 104775, Durham, North Carolina 27701, USA. Email: svati.shah@duke.edu.
Find articles by Floyd, J. in: PubMed | Google Scholar
1Duke Molecular Physiology Institute, Duke University School of Medicine, Durham, North Carolina, USA.
2Cardiovascular Medicine, Beth Israel Deaconess Medical Center, Boston Massachusetts, USA.
3Cardiometabolic Trials Unit, Division of Endocrinology and Diabetology, Medical University of Graz, Graz, Austria.
4Duke Clinical Research Institute, Durham, North Carolina, USA.
5Institute of Cardiovascular & Medical Sciences, University of Glasgow, Glasgow, United Kingdom.
6Division of Cardiology, Department of Medicine, Duke University School of Medicine, Durham, North Carolina, USA.
7Diabetes Trials Unit, Radcliffe Department of Medicine, University of Oxford, Oxford, United Kingdom.
8Cardiovascular Health Research Unit, Department of Medicine, and
9Departments of Epidemiology and Health Systems and Population Health, University of Washington, Seattle, Washington, USA.
Address correspondence to: Svati H. Shah, 300 N Duke Street, DUMC Box 104775, Durham, North Carolina 27701, USA. Email: svati.shah@duke.edu.
Find articles by Shah, S. in: PubMed | Google Scholar
Published July 2, 2026 - More info
JCI Insight. 2026;11(16):e204463. https://doi.org/10.1172/jci.insight.204463.
© 2026 Corey et al. This work is licensed under the Creative Commons Attribution 4.0 International License. To view a copy of this license, visit http://creativecommons.org/licenses/by/4.0/.
Received: January 13, 2026; Accepted: June 25, 2026


-
Introduction
Cardiovascular disease remains the leading cause of mortality in the world, accounting for nearly 1 in every 5 deaths annually. Despite advances in prevention and treatment, the burden of major adverse cardiovascular events (MACE), including nonfatal stroke, nonfatal myocardial infarction, and cardiovascular death, remains elevated, largely driven by an aging population and increasing prevalence of risk factors such as obesity and type 2 diabetes mellitus (T2DM) (1). Unfortunately, despite widely accepted high-risk stratification tools such as the Atherosclerotic Cardiovascular Disease (ASCVD) risk calculator, Framingham risk score, Systematic Coronary Risk Evaluation 2 (SCORE2), and ADVANCE score (with specific T2DM clinical features), the accuracy of these clinical prediction algorithms is incomplete in identifying individuals who will develop MACE (2, 3). These clinically utilized prediction scores consist of traditional comorbidity-based risk factors including age, T2DM, hypertension, and smoking status, among others. However, there remains marked heterogeneity for risk of MACE, making it difficult to accurately stratify this population based on clinical comorbidities alone.
Furthermore, the growing recognition of the significant health benefits of glucagon-like peptide-1 receptor agonists (GLP-1 RA) to provide additional cardiovascular protection for people with T2DM as well as obesity have made high-risk MACE stratification even more urgent (4, 5). Multiple large meta-analyses and randomized controlled trials of GLP-RAs have demonstrated up to 14% reduction of MACE in patients both with and without T2DM (6–8). Although it is well-established that GLP-1 RA treatment prevents MACE in individuals with T2DM and obesity, the potential pleiotropic biological mechanisms of the treatment effect are incompletely understood. Clinically, these incretin mimetic therapies can result in significant weight loss and improve glycemic control by slowing gastric emptying and optimizing insulin and glucagon secretion (9, 10). However, clinical trials have demonstrated a reduction in MACE with GLP-1 RA therapy despite minimal weight loss, raising the possibility of direct tissue effects on atherosclerosis (11, 12). Further studies have demonstrated improvement in systemic inflammation, endothelial function, and attenuation of platelet aggregation (13–15). Given the high cost of and significant demand for GLP-1 RA therapy, identifying particular patients who may benefit most from these medications is a priority (9, 16).
Recent developments in high-throughput discovery proteomics offer a promising approach to predicting poor health outcomes (17, 18). This technology has the ability to quantify thousands of molecules from a single plasma sample and the potential to not only identify otherwise unknown biomarkers but shed light on biological underpinnings that give rise to the heterogeneity of health risks for deleterious outcomes such as MACE (19, 20). Thus, the primary objective of this study is to use high-throughput discovery proteomics with machine learning, external validation, and assessment of therapeutic modulation (Figure 1) to identify circulating biomarkers with potential clinical utility for MACE risk prediction, including evaluation of performance above clinical factors and potential therapeutic modifiability by a commonly used medication class (GLP-1 RA) with beneficial effects on MACE. These secondary analyses were intended to interpret the prioritized proteins rather than to comprehensively map the causal or pathway architecture of MACE, which remained beyond the scope of this predictive study.
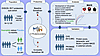 Figure 1
Study overview and analytic workflow. Overview of the EXSCEL proteomics subcohort, proteomic profiling, analytic framework, and external validation strategy. A randomized EXSCEL subcohort with available plasma samples underwent SomaScan 5K proteomic profiling at baseline and 12 months. Baseline proteins were evaluated for association with MACE, and prioritized proteins were incorporated into supervised machine learning models to develop a 140-protein risk score. Additional analyses included treatment responsiveness, biological contextualization analyses, and external validation in the CHS and PROMISE cohorts. MACE included nonfatal myocardial infarction, nonfatal stroke, and cardiovascular death. ASCVD, atherosclerotic cardiovascular disease; CHS, Cardiovascular Health Study; EXSCEL, Exenatide Study of Cardiovascular Event Lowering; MACE, major adverse cardiovascular events; PROMISE, Prospective Multicenter Imaging Study for Evaluation of Chest Pain; RCT, randomized controlled trial; T2DM, type 2 diabetes mellitus.
-
Results
Baseline participant characteristics.
The Exenatide Study of Cardiovascular Event Lowering (EXSCEL) discovery substudy cohort had a high prevalence of previous cardiovascular disease at baseline (72.2%); 14.7% (n = 758) of participants experienced MACE during the study period (placebo 380/2,560 [14.8%] and GLP-1 RA 378/2,565 [14.7%]) over a median follow-up time of 3.2 years (IQR 2.2, 4.4). Participants who experienced MACE tended to be older, male, and with a higher prevalence of traditional risk factors, including history of ASCVD, duration of T2DM, and smoking, but were similar in BMI, LDL cholesterol (LDL-C), HbA1c, and creatinine concentration to those who did not experience MACE (Table 1). The EXSCEL proteomics cohort and the parent EXSCEL trial cohort had similar demographic characteristics, although the proteomics cohort had a lower prevalence of individuals from self-reported non-White races (Supplemental Table 1; supplemental material available online with this article; https://doi.org/10.1172/jci.insight.204463DS1). Supplemental Tables 2 and 3 list baseline participant characteristics for the validation cohorts, the Cardiovascular Health Study (CHS) and Prospective Multicenter Imaging Study for Evaluation of Chest Pain (PROMISE), respectively. Having established the baseline clinical characteristics of the EXSCEL proteomics cohort, we next evaluated whether circulating proteins could improve prediction of MACE beyond traditional clinical factors.
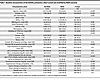 Table 1
Baseline characteristics of the EXSCEL proteomics cohort overall and stratified by MACE outcome
Protein model and protein score development.
Baseline proteins associated with MACE (FDR P < 0.05) in Cox proportional hazard models were used as input variables in prediction models (Supplemental Table 4). Penalized regression models showed higher AUROCs than decision tree–based models (random forest and gradient-boosted decision trees) in discriminating MACE events and overall demonstrated high predictive performance for MACE (AUROC 0.75 [95% CI: 0.72–0.78] vs. 0.64 [95% CI: 0.60–0.66], respectively, P < 0.001) (Figure 2, Table 2, and Supplemental Table 6), prioritizing 140 proteins in the held-out test set (Supplement Table 5).
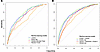 Figure 2
Receiver operating characteristic curves for proteomic and clinical prediction models in the EXSCEL proteomics cohort. (A) Receiver operating characteristic (ROC) curves for proteomic machine learning models (LASSO, elastic net, random forest, and gradient-boosted decision trees) for discrimination of MACE. (B) ROC curves for protein-only, clinical-only, and protein plus clinical models. Clinical features were derived from the SCORE2, ADVANCE, and ASCVD Risk Estimator models. All ROC curves were evaluated in the held-out test set of the EXSCEL proteomics cohort.
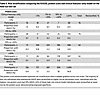 Table 5
Risk stratification comparing the EXSCEL protein score and clinical features–only model on the held-out test set
In assessing discriminative capability and improvement over a clinical model, the LASSO model demonstrated higher discrimination of MACE than the clinical model (AUROC 0.75 [95% CI: 0.72–0.78] vs. 0.69 [95% CI: 0.66–0.73], respectively, P < 0.05), and added to a clinical model (clinical plus protein: AUROC of 0.79 [95% CI: 0.76–0.82], P < 0.05). The area under the precision-recall curve (AUPRC) of the protein plus clinical model was higher than the protein-only model (AUPRC 0.40 [95% CI: 0.37–0.44] vs. AUPRC 0.46 [95% CI: 0.40–0.52], respectively, P < 0.001). Both of these models had higher AUPRC compared with the clinical model (AUPRC 0.25 [95% CI: 0.22–0.29], P < 0.001) for difference in AUPRC of clinical-only versus clinical plus protein models and clinical-only versus protein-only models (Figure 2, Table 3, and Supplemental Table 7). Consistent with the reclassification patterns shown in Table 5, the protein score demonstrated an overall categorical net reclassification index of 0.21 and an integrated discrimination improvement index of 0.023 relative to the clinical features–only model, indicating clinically significant improved risk reclassification beyond clinical features alone.
A protein score was then developed from the LASSO protein model weights. The protein score was predictive of MACE in the held-out test set (EXSCEL protein score HR per 1 SD increase (standardized score) 2.24 [95% CI: 2.16–2.32], P ≤ 2.25 × 10⁻⁷ and AUROC 0.70 [95% CI: 0.69–0.71]). A Brier score of 0.091, Hosmer-Lemeshow P value of 0.93, and risk stratification table (Table 4) demonstrated appropriate model calibration. Across prespecified risk strata in the held-out test set, observed MACE rates increased from 0.4% (<5% risk) to 10.0% (≥20% risk) for the protein score, demonstrating clear risk separation. In cross-classification with the clinical model, 42% of individuals categorized as 20% or higher risk by the clinical model were reclassified into lower protein-score risk categories, while the highest protein-score stratum retained the highest observed event rate, consistent with improved specificity and risk stratification (Table 5).
To better understand which individual proteins were driving performance of the proteomic models, we next examined protein prioritization across the Cox and machine learning approaches. The individual protein Cox proportional hazard models and proteomic machine learning models, including tree-based and penalized regression models, all prioritized tetranectin (tetranectin: Cox model HR 0.11 [95% CI: 0.07–0.16], FDR adjusted P = 2.33 × 10⁻¹⁰) and fibulin-1 (Cox model HR 6.48 [95% CI: 4.13–10.19], FDR adjusted P = 3.14 × 10⁻⁶), demonstrating concordance in protein prioritization across multiple statistical methods and robustness in the protein association with MACE (Figure 3). Not only were these 2 proteins consistently prioritized across multiple models with the highest Gini index–based importance scores, they also were assigned the highest absolute LASSO model weights amongst prioritized proteins (tetranectin, –0.11; fibulin-1, 0.10) (Supplemental Figure 1 and Supplemental Table 5). In bootstrap stability analyses (1,000 replicates), the 2 most consistently prioritized proteins were very frequently reselected (tetranectin, 91.3% and fibulin-1, 89.6%), supporting the robustness of these proteins.
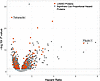 Figure 3
Volcano plot demonstrating model-prioritized MACE proteins in EXSCEL proteomics cohort. Multivariate Cox proportional hazards models identified 1,278 individual proteins that were significantly associated with MACE (FDR adjusted P < 0.05) in the EXSCEL proteomics cohort (gray); 140 of these proteins were prioritized in the LASSO model (red). The 2 proteins with the absolute highest LASSO model weights were tetranectin and fibulin-1.
Given the strong importance of these specific proteins in predicting MACE, we tested the prediction strength of these proteins alone. Tetranectin and tetranectin plus fibulin-1 showed decent MACE discrimination (AUROC 0.61 [95% CI: 0.59–0.64] and 0.65 [95% CI: 0.62–0.68], respectively; and AUPRC 0.31 [95% CI: 0.28–0.33] and 0.35 [95% CI: 0.32–0.38], respectively). Further, the addition of these 2 proteins to the clinical model improved discrimination, yielding an AUROC of 0.74 (95% CI: 0.71–0.78) and an AUPRC of 0.30 (95% CI: 0.26–0.35), with an increase in AUROC of 0.05 and AUPRC of 0.05 compared with the clinical features–only model (P = 0.017). Notably, the AUROC of the clinical plus tetranectin and fibulin-1 model was similar to the full protein-only model, though the AUPRC was higher in the full protein-only model (AUROC of 0.74 [95% CI: 0.71–0.78] and AUPRC 0.30 [95% CI: 0.26–0.35]) versus AUROC of 0.75 [95% CI: 0.72–0.78] and AUPRC 0.40 [95% CI: 0.37–0.44], P = 0.017, respectively), demonstrating the predictive strength of tetranectin and fibulin-1 for MACE. Both models had a higher point-estimate discrimination than the clinical features–only model (ΔAUPRC 0.044 [95% CI: 0.007–0.082], P = 0.017) (Figure 2, Table 3, and Supplemental Table 7). Because tetranectin and fibulin-1 were the most consistently prioritized proteins, we then evaluated their relationships with established clinical features associated with cardiovascular risk to better contextualize these biomarkers.
Tetranectin and fibulin-1 were associated with history of ASCVD, baseline BMI, and HbA1c.
Tetranectin and fibulin-1 were associated with history of ASCVD in the EXSCEL cohort in multivariable logistic regression analyses (tetranectin: OR per 1 SD 0.30 [95% CI: 0.19–0.49], P = 0.003 and fibulin-1: OR per 1 SD 3.86 [95% CI: 2.40–6.24], P = 9.32 × 10⁻⁴). To better understand this relationship between tetranectin, fibulin-1, history of ASCVD, and MACE, we tested their correlation with baseline ASCVD prevalence in EXSCEL. Baseline tetranectin levels were lower (P < 0.05) and baseline circulating levels of fibulin-1 were higher in individuals with a history of ASCVD compared with individuals without a history of ASCVD (P < 0.05). Furthermore, subset analyses on cohorts with a history of ASCVD demonstrated that patients who developed MACE had significantly lower levels of baseline tetranectin (P = 0.038) and higher levels of baseline fibulin-1 (P = 0.029) compared with patients without MACE, providing further stratification for risk of MACE (Supplemental Figure 2 and Supplemental Table 8, Supplemental Figure 3, and Supplemental Table 9). Baseline tetranectin and fibulin-1 levels were correlated with other known high-risk clinical features associated with MACE, such as baseline BMI (r = –0.06, P = 0.023 and r = 0.14, P = 1.80 × 10⁻⁷, respectively) and baseline HbA1c (tetranectin r = –0.13, P = 2.48 × 10⁻⁷). We next tested whether the prioritized proteomic signature and top-ranked proteins were biologically responsive to GLP-1 RA treatment over time.
GLP-1 RA treatment beneficially modified protein score and tetranectin.
Linear mixed-effect modeling adjusted for change in BMI and HbA1c was used to assess whether there was a differential change in high-risk proteins in participants randomized to GLP-1 RA treatment versus a placebo. Model results demonstrated that the protein score decreased and tetranectin levels increased in the treatment arm compared with the placebo arm (P = 0.005 and P = 0.002, respectively) (Figure 4). Visual inspection of raw protein distributions showed only modest shifts over time, consistent with the small mean changes observed in each treatment arm (Supplemental Figure 4 and Supplemental Table 10). Fibulin-1, however, did not show significant modification by GLP-1 RA treatment after 1 year.
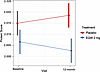 Figure 4
Differential change in MACE proteomics score with GLP-1 RA treatment in EXSCEL. Linear mixed model adjusted for change in BMI and HbA1c demonstrated differential change in the MACE protein score with GLP-1 RA treatment over 12 months (P = 0.005).
Given these results and the known strong weight loss effects of GLP-1 RA, we next evaluated whether treatment-associated protein changes were mediated by weight loss from baseline to 12 months. Of the 140 proteins in the proteomic score, 47 were significantly modified by GLP-1 RA (P < 0.05) (Supplemental Table 5). Among these 47 treatment-responsive proteins, 24 showed statistically significant mediation by weight loss in the same direction as the direct effect. However, the magnitude of mediation was generally modest, with 15 of these 24 proteins showing less than 15% of the treatment effect explained by weight loss. Together, these results suggest that most GLP-1 RA–associated protein changes primarily reflect weight-loss–independent mechanisms (Supplemental Table 11).
Longitudinal change in protein score for incident MACE.
Having established that higher levels of the baseline protein score were predictive of incident MACE, we next tested whether change in the protein score from baseline to 12 months was also prognostic of subsequent MACE. In a 12-month landmark analysis (n = 3,742; 409 events), a decrease in the scaled protein score from baseline to 12 months, modeling a directionally beneficial decrease, was associated with lower subsequent MACE risk (HR per 1 SD decrease 0.68 [95% CI 0.59–0.79], P < 0.05). These findings indicate that a decrease (i.e., improvement) in the protein score over time is prognostic of improved incident MACE outcomes.
Protein score and individual top-ranked proteins validated in CHS and PROMISE cohorts.
The model weights from the protein score were applied to matching proteins in the CHS cohort (T2DM and non-T2DM). The protein score’s ability to predict time to MACE was validated in the CHS cohort with multivariable Cox proportional hazard models using held-out test sets (CHS protein score HR per 1 SD increase [standardized score] 1.33 [95% CI: 1.17–1.52], P = 1.6 × 10⁻⁵ and AUROC 0.68 [95% CI: 0.65–0.72]). Association of protein score tertiles with time-to-MACE risk was performed for visualization (Kaplan-Meier curves) in both EXSCEL and CHS, demonstrating a linear increase in the risk of MACE across increasing tertiles of the protein score (Figure 5). Although tetranectin was associated with time to MACE in the overall CHS cohort (tetranectin HR 0.82 per 1 SD [95% CI: 0.73–0.93], P = 0.002), fibulin-1 was not.
 Figure 5
Kaplan-Meier survival curves comparing tertiles of the MACE protein score in EXSCEL and CHS cohorts. Survival curves demonstrate multivariate Cox proportional hazard models for time to MACE and tertiles of protein score representing high, medium, and low risk of MACE across the 2 cohorts.
The full protein score could not be assessed in the PROMISE cohort due to differences in proteomics platforms. However, in multivariable logistic regression models, tetranectin was associated with MACE (MACE OR per 1 SD 0.88 [95% CI: 0.80–0.98] P = 0.013) in the overall PROMISE cohort, but fibulin-1 was not.
Protein score and tetranectin were associated with baseline ASCVD in CHS and PROMISE.
To further characterize the clinical relevance of the validated biomarkers, and given the known strong association of prevalent ASCVD with incident MACE, we then examined their associations with prevalent ASCVD and coronary disease burden in the external cohorts. The protein score was significantly associated with baseline ASCVD in CHS (OR 1.04 per 1 SD increase in score [95% CI: 1.03–1.06], P = 2 × 10⁻¹¹). Furthermore, similar to the results found in the EXSCEL cohort, lower levels of baseline tetranectin were associated with history of ASCVD in multivariable regression analyses in both validation cohorts: (CHS OR 0.98 per 1 SD [95% CI: 0.97–0.99], P = 0.003; PROMISE OR per 1 SD 0.80 [95% CI: 0.68–0.93], P = 0.004), and lower levels of baseline tetranectin were associated with history of coronary artery disease (CAD) in multivariable regression analyses in both replication cohorts (CHS tetranectin OR per 1 SD 0.99 [95% CI: 0.98–0.99], P = 0.04; PROMISE tetranectin OR per 1 SD 0.80 [95% CI: 0.68–0.93], P = 0.004). Fibulin-1 protein levels were not associated with ASCVD or CAD in either cohort (Supplemental Table 12). Furthermore, Pearson’s correlation analyses demonstrated significant negative correlations between tetranectin levels and CT angiography–adapted Leaman scores in the PROMISE cohort (r = –0.20, P = 4.36 × 10⁻⁴). Taken together, these findings indicate that lower circulating tetranectin is consistently associated with prevalent atherosclerotic disease across independent cohorts, supporting its role as a marker of underlying cardiometabolic risk rather than a cohort-specific signal.
Protein score and top-ranked proteins’ association with MACE were not specific to T2DM.
Because our protein score was developed in a T2DM cohort, we sought to evaluate whether its strong predictive abilities were unique to MACE in people with T2DM or MACE in general. Thus, we performed analyses in T2DM-only and non-T2DM subsets in the CHS cohort, which demonstrated that the protein score remained associated with MACE in multivariable Cox proportional hazard models regardless of T2DM status (T2DM CHS n = 381: HR 1.32 per 1 SD [95% CI: 1.02–1.71], P = 0.04; non-T2DM CHS n = 2,382: HR 1.33 per 1 SD [95% CI: 1.15–1.55], P = 2.1 × 10⁻⁴). Tetranectin and fibulin-1 were also evaluated in T2DM and non-T2DM subsets in the validation cohorts. Tetranectin was associated with time to MACE in multivariable analyses in the subset of participants without T2DM (CHS non-T2DM n = 2,382: HR 0.82 per 1 SD [95% CI: 0.71–0.94], P = 0.005; PROMISE non-T2DM n = 681: HR 0.85 per 1 SD [95% CI: 0.76–0.94], P = 0.002), but fibulin-1 was not (Supplemental Table 12). In the CHS T2DM subset, tetranectin showed a similar magnitude of effect for time to MACE, but was not statistically significant possibly due to sample size (CHS T2DM n = 381, tetranectin: HR 0.85 per 1 SD [95% CI: 0.65–1.10], P = 0.21). Interestingly, baseline tetranectin in the PROMISE cohort was also significantly lower in patients with T2DM compared with those without T2DM (OR per 1 SD 0.08 [95% CI: 0.05–0.11], P = 5 × 10⁻⁵) (Supplemental Figure 5 and Supplemental Table 13). Overall, these results demonstrate that the protein score and tetranectin levels are not unique to T2DM as they predict MACE in individuals with and without T2DM. To explore whether the top-ranked proteins might reflect causal mediators of risk rather than biomarkers of underlying disease burden, we next performed Mendelian randomization analyses.
Mendelian randomization analyses suggest that tetranectin and fibulin-1 are not in the causal pathway for MACE or CAD.
We focused these analyses on tetranectin and fibulin-1 because they were the most consistently prioritized and most stable proteins in our study, reselected in 91.3% and 89.6% of bootstrap replicates, respectively, and ranked highest across the Cox, tree-based, and penalized regression models. Given their dominant contribution to model performance, we sought to determine whether they were likely to act as causal mediators of risk or instead as biomarkers of underlying disease burden. Inverse variance–weighted Mendelian randomization analyses did not demonstrate an association between tetranectin with MACE and CAD (nonfatal stroke: β estimate = –0.032, SE = 0.022, P = 0.12, nonfatal myocardial infarction: β = 0.01, SE = 0.19, P = 0.5, cardiovascular death: β = 0.087, SE = 0.067, P = 0.21, CAD: β = −0.082, SE = 0.15 P = 0.6). Similarly, fibulin-1 was not associated with MACE or CAD (nonfatal stroke: β = −0.14, SE = 0.31, P = 0.9; nonfatal myocardial infarction: β = −0.074, SE = 0.33, P = 0.8; cardiovascular death: β = 0.031, SE = 0.02, P = 0.2; CAD: β = 0.044, SE = 0.049, P = 0.4). These results suggest that neither tetranectin nor fibulin-1 are likely in the causal pathway for CAD or MACE. The Mendelian randomization analysis null findings therefore reflect a deliberate causal test applied to our most reproducible biomarkers, and supports their interpretation as markers of residual atherosclerotic and fibrotic risk rather than as causal targets.
Gene set enrichment analysis identified enriched protein complement pathway.
Finally, to place the prioritized proteins in broader biological context, we performed pathway enrichment analyses using proteins associated with MACE in the discovery cohort. Because enrichment was evaluated at the aggregate gene-set level across the full ranked list of nominally significant proteins, rather than relying on the stable selection of any single protein, these results are relatively robust to the prioritization instability of individual proteins and are presented as hypothesis-generating biological context for the MACE-associated proteome. Pathway analyses were conducted on proteins that were nominally significant from the initial discovery multivariable Cox proportional hazard models (1,278 proteins; Supplement Table 1), highlighting enrichment of the complement pathway (FDR < 0.05) and top-ranked KEGG pathways of fatty acid metabolism (nominal P = 0.01) and cardiac muscle contraction (nominal P = 0.04).


